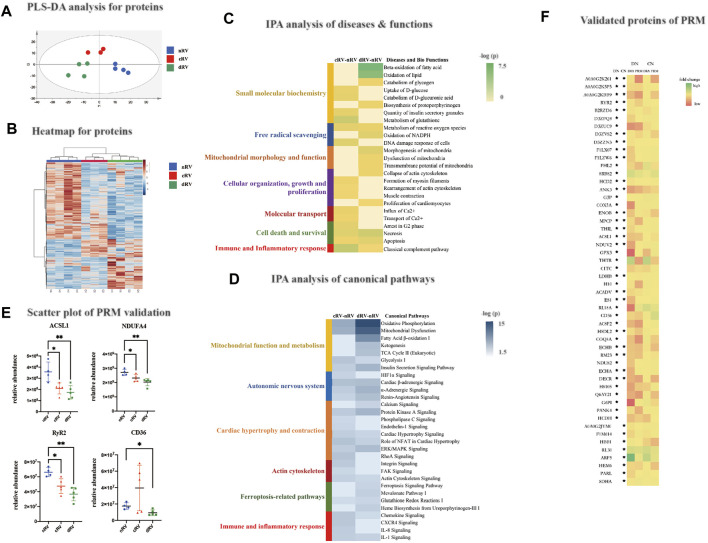
FIGURE 3.
RVF proteomic analysis of the present study. (A) The partial least squares discriminant analysis (PLSDA) score plot based on the DIA data of the myocardial proteome from nRV rats (blue), cRV rats (red), and dRV rats (green). (B) The hierarchical clustering based on the quantification of differentially expressed proteins (DEPs) among different stages. (C) The hierarchical clustering based on the p-value of functions from IPA annotation. (D) The hierarchical clustering based on the p-value of canonical pathways from IPA annotation. (E) The scatterplots of four major DEPs’ relative abundance based on the PRM validation. (F) A color histogram based on the fold change in the DIA and PRM modes of the validated proteins. * The protein that was significantly altered in the corresponding group. CN, the comparison group of cRV and nRV (cRV/nRV); DN, the comparison group of dRV and nRV (dRV/nRV).

