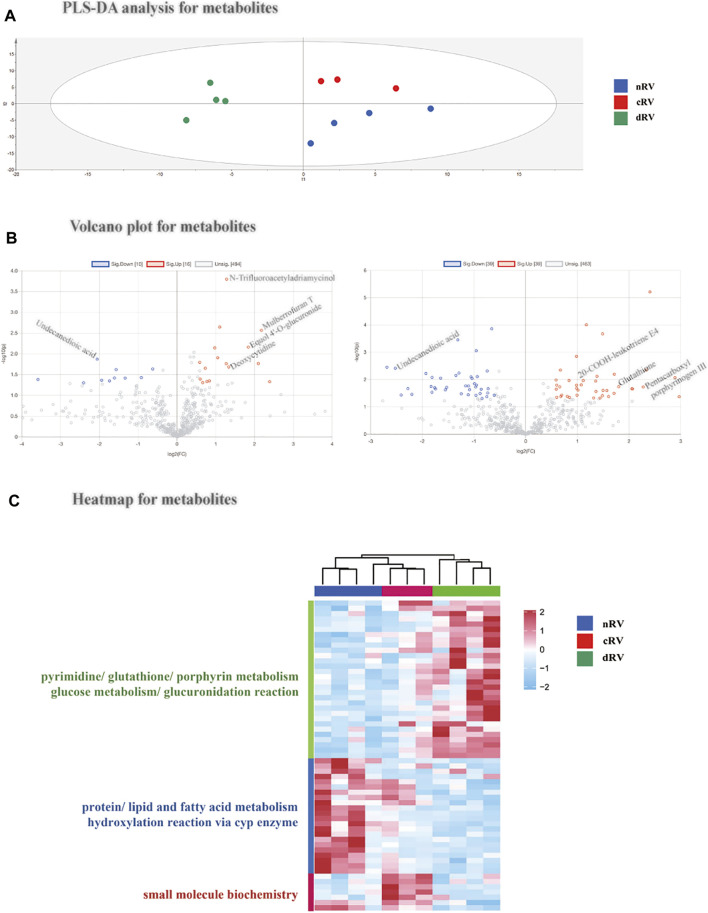
FIGURE 4.
RVF metabolomic analysis of the present study. (A) The partial least squares discriminant analysis (PLSDA) score plot based on the quantification of the myocardial metabolome from nRV rats (blue), cRV rats (red), and dRV rats (green). (B) The volcano plots of the identified metabolites between cRV–nRV (left) and dRV–nRV (right). (C) The hierarchical clustering based on the quantification of altered metabolites among different stages and their function annotation.

