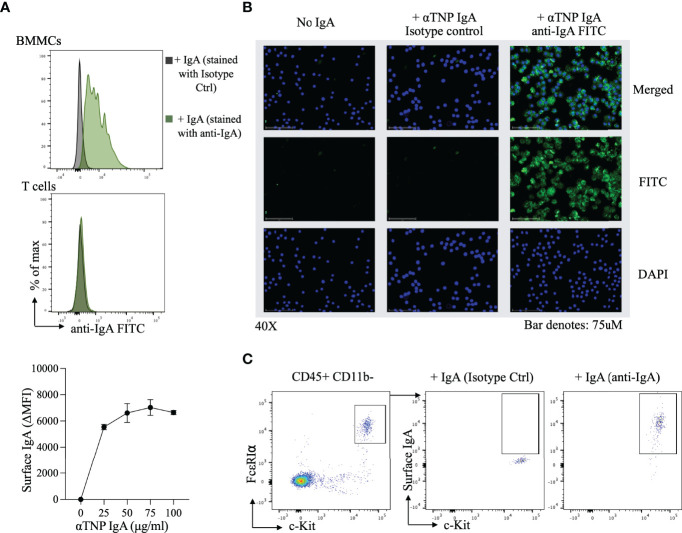
Figure 2.
Surface IgA staining on bone marrow derived mast cells and peritoneal mast cells (A) Flow-cytometric evaluation of IgA binding to BMMCs. Representative histogram of αTNP IgA binding to BMMCs (top) and purified splenic T cells (middle), and a dose response curve of αTNP IgA binding to BMMCs. Mast cells incubated with or without anti-TNP IgA were stained with antibodies for c-Kit, FcϵRIα, and IgA and analyzed by flow cytometry. Purified splenic T cells incubated with or without anti-TNP IgA were stained with antibodies for CD3, CD4, and IgA and analyzed by flow cytometry. Data shown is one experiment representative of six independent experiments. (B) Immunofluorescence analysis of IgA binding to BMMCs. Representative photomicrographs (40x) of BMMCs incubated with or without 100µg/ml of αTNP IgA in HBSS for 30 minutes at 4°C. BMMCs were stained for nucleus (blue), IgA (green), or isotype control (middle), and merged (right). Scale bars: 75 µm. Images were taken using an EVOS M7000 microscope. Data shown is one experiment representative of two independent experiments. (C) Flow-cytometric evaluation of IgA binding to peritoneal mast cells. Representative flow cytometry plots of IgA staining on peritoneal cavity mast cells, identified by the presence of CD45, c-Kit, FcϵRIα. Data shown is one experiment representative of two independent experiments.

