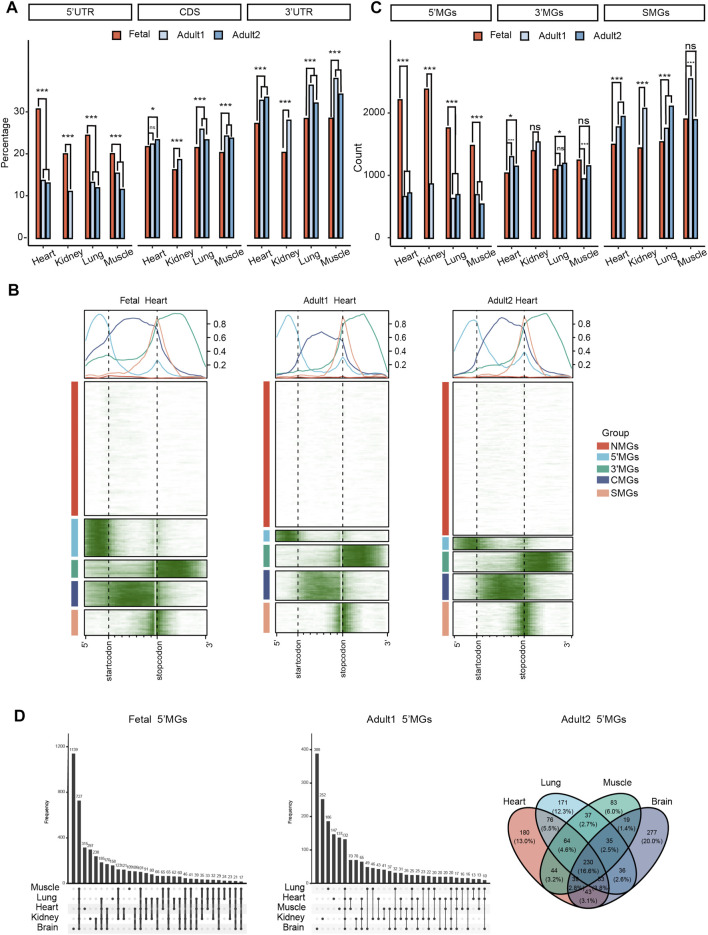
FIGURE 1.
Different m6A topological patterns between human fetal and adult tissues. (A) The frequency of m6As located in the 5′ UTRs, CDS, and 3′ UTRs among human tissues in fetal and adult stages (z-test, ***p value < 0.001, *p value < 0.05, ns: not significantly). Adult1 means the first dataset of adult tissues and adult2 means the second datasets. (B) The m6A topological patterns along the m6A deposited regions in human fetal and adult heart tissues. We defined those five group genes as NMGs, 5′MGs, 3′MGs, CMGs, SMGs according to the m6A deposited regions. White color means without m6A peak, green color means with m6A peak. (C) The frequency of 5′MGs, 3′MGs and SMGs among human tissues in fetal and adult stages (z-test, ***p value < 0.001, *p value < 0.05, ns: not significantly). (D) The overlap of 5′MGs across all fetal (left) and adult (right) tissues.

