FIGURE 2.
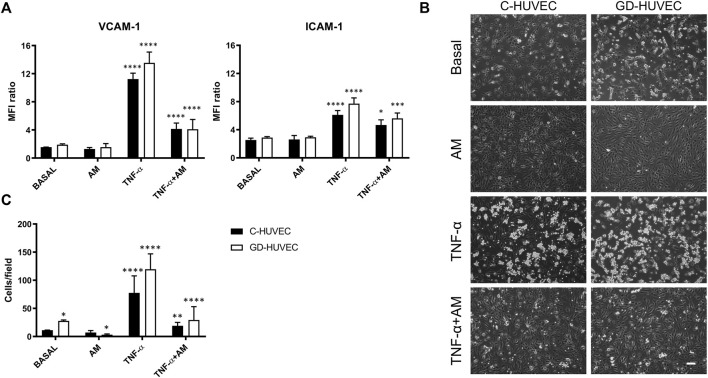
Effect of AM on VCAM-1 and ICAM-1 membrane exposure and TNF-α-induced monocyte adhesion in C- and GD-HUVECs analyzed by flow cytometry. (A) VCAM-1 and ICAM-1 membrane exposure in C- and GD-HUVECs untreated (basal) and treated for 16 h with 1 ng/ml of TNF-α with or without AM incubation (24 h). Quantitative data in the histograms show the mean fluorescence intensity (MFI) ratio between the signal and the background noise. The experiments were performed using five different cellular strains for C- and five different cellular strains for GD-HUVECs (n = 5). ANOVA and Tukey’s multiple comparison test: *p < 0.05 TNF-α + AM vs. TNF-α; ***p < 0.001 TNF-α+AM vs. TNF-α; ****p < 0.0001 TNF-α vs. basal and vs. AM; ****p < 0.0001 TNF-α + AM vs. TNF-α. (B) Monocyte-endothelial cell interaction on C- and GD-HUVECs untreated (basal) and incubated with AM (24 h) after TNF-α stimulation for 16 h. Representative pictures of C- and GD-HUVECs for each experimental condition. Bar represents 100 µm. Quantitative data, in the histogram (C), show the number of adherent U937 cells obtained by analyzing the microscope images of four different cellular strains for both C-HUVECs and GD-HUVECs (n = 4), each including 12 counts per condition. Each measurement is defined as the mean ± SD of adherent monocytes. ANOVA and Tukey’s multiple comparison test: *p < 0.05 basal GD-HUVEC vs. basal C-HUVEC and AM GD-HUVEC vs. basal GD-HUVEC; **p < 0.01 TNF-α + AM vs. TNF-α; ****p < 0.0001 TNF-α vs. basal and vs. AM, TNF-α + AM vs. TNF-α.

