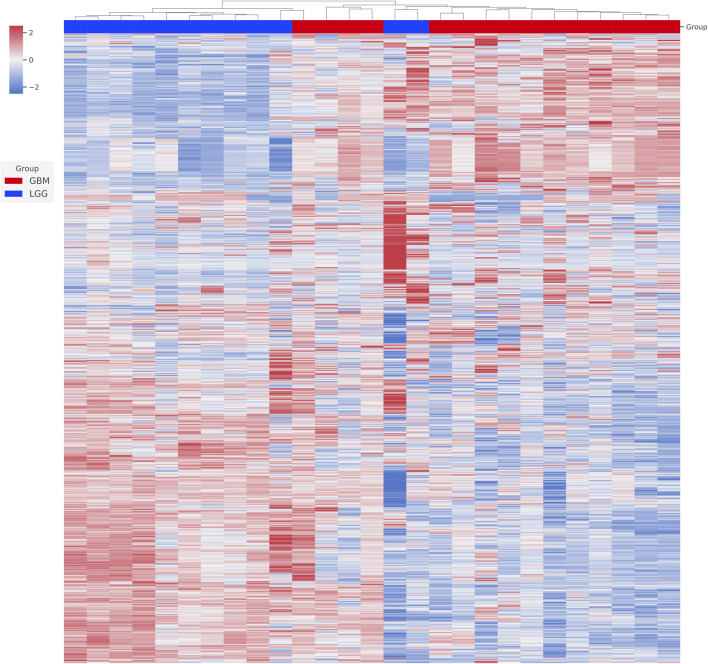
FIGURE 1.
Unsupervised clustering of patient gene expression profiles. The transcriptome of each patient was first obtained from RNA-seq analysis. The top 2,000 genes with differential expression were then used in hierarchical clustering. Relative gene expression levels (from +2 to -2) are indicated by red and blue color shades. Patients’ WHO classifications at diagnosis are color coded.

