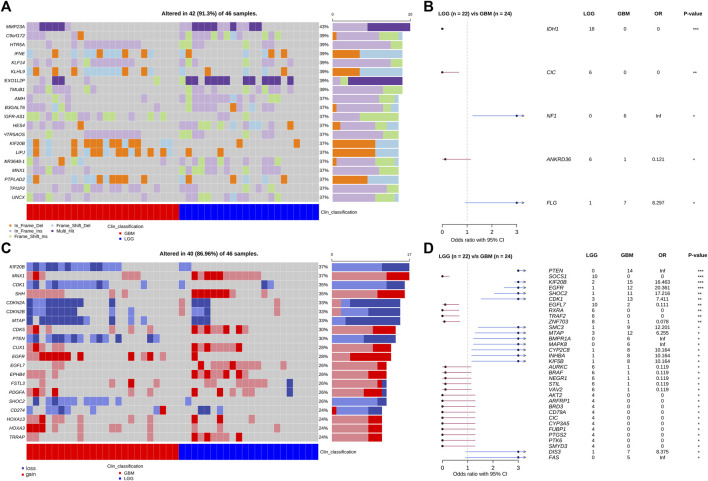
FIGURE 4.
Somatic SNV, indel, and CVN mutations of patients obtained from WES analysis. (A) Top 20 genes with the highest SNV/Indel mutation frequency in the patient cohort. (B) Forest plot of SNV genes with significant distribution difference in LGG and GBM patients. (C) Top 20 genes with the highest CNV frequency in the patient cohort. (D) Forest plot of CNV genes with significant distribution difference in LGG and GBM patients. *: p < 0.05; **: p < 0.01; ***: p < 0.001.

