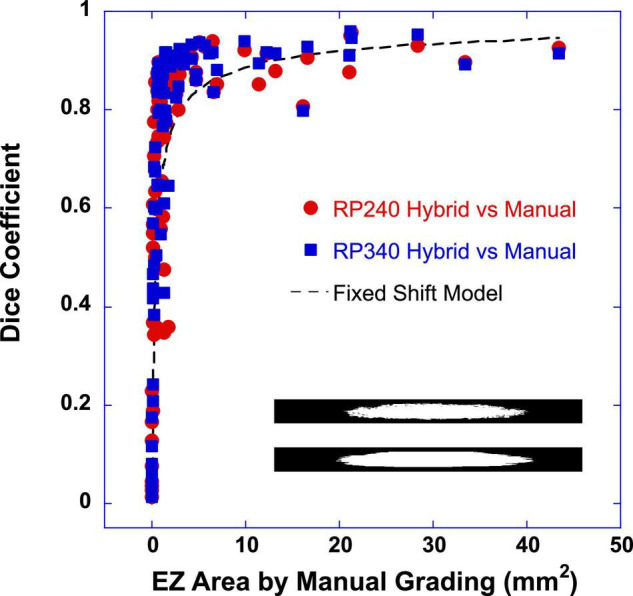
FIGURE 1.

Dice similarity coefficient was plotted as a function of ellipsoid zone (EZ) area determined by the manual grading of the reading center. Close red circles were the dice coefficients between the EZ band area determined by the RP240 hybrid model and that by the manual grading. Closed blue squares were the dice coefficients between the EZ band areas determined by the RP340 hybrid model and the manual grading. The inset images (121 × 1,536 pixels) showed two examples of EZ band segmentations of 121 B-scan lines used for pixel-wise comparison to obtain the dice coefficient (top: by RP340 hybrid model; bottom: by manual grading of the reading center). The dashed line is the output of a simple fixed shift model for dice coefficient between two same size circles. In this example, the constant lateral shift between two circles was 55 pixels (0.315 mm).
