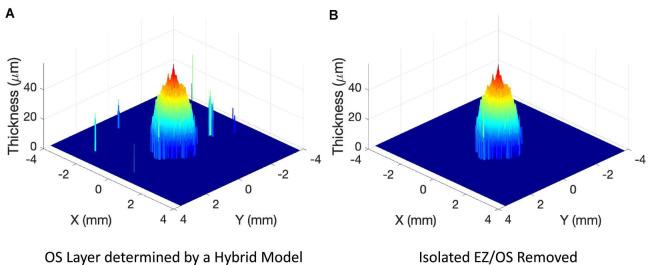
FIGURE 2.
Examples of 3-dimensional plot of photoreceptor outer segment (OS) layer from a 9-mm 121-line SD-OCT volume scan of a patient with retinitis pigmentosa. (A) OS layer determined by a hybrid deep learning model described in the method. (B) OS layer after off-center isolated local ellipsoid zone (EZ)/OS areas shown in panel (A) were removed.

