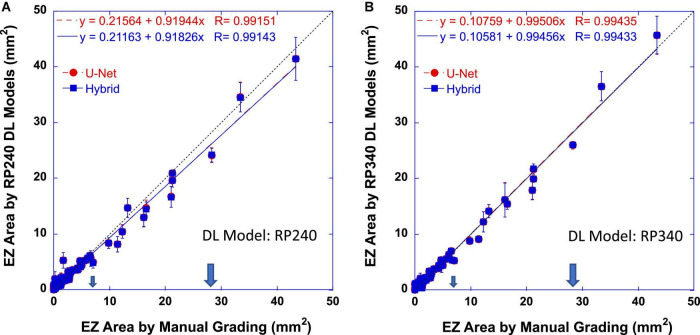
FIGURE 3.
Ellipsoid zone (EZ) areas determined automatically by RP240 (A) and RP340 (B) deep learning (DL) models as functions of that by the reading center. Red circles and dashed lines are the measurements of the U-Net model. Blue squares and solid lines are the measurements of the hybrid model. Dotted lines have a slope of one. The large arrows mark the central retinal area with a radius of 3 mm from the fovea (28.3 mm2). The small arrows mark the central retinal area with a radius of 1.5 mm from the fovea (7.0 mm2). Error bars indicate ±1 standard deviation of three measurements by the same model type but trained three times separately on the same datasets. The equations in the plots were the Pearson correlation coefficients (R) and the linear regression fitting result of the data (red for U-Net and blue for the hybrid model).

