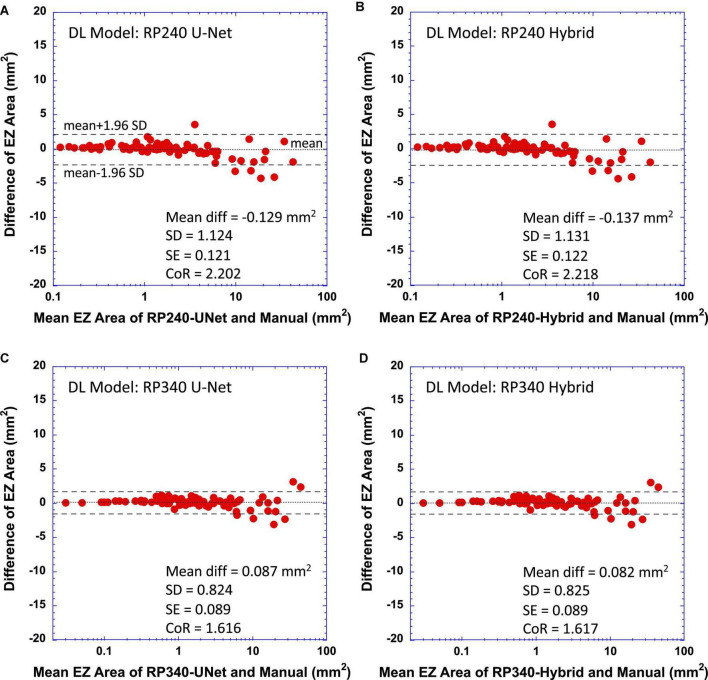
FIGURE 4.
Bland-Altman plots of difference of measurements between deep learning (DL) models and the reading center vs. their mean. (A) RP240 U-Net vs. manual grading; (B) RP240 hybrid model vs. manual grading; (C) RP340 U-Net vs. manual grading; and (D) RP340 hybrid model vs. manual grading. Coefficient of repeatability (CoR) is defined as 1.96 times the standard deviation of the difference. Dashed horizontal lines represent ±95% limit of agreement (mean ± CoR). Dotted horizontal lines represent the mean difference.

