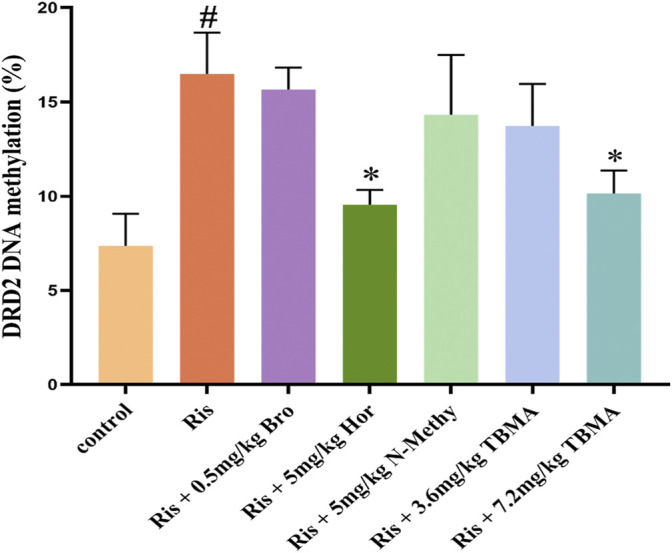
FIGURE 5.

DRD2 methylation status. Data are presented as the mean ± SD (n = 3 per group). ( # p < 0.05 versus the control group; * p < 0.05 versus the Ris group). Bro = bromocriptine; Hor = hordenine; N-Methy = N-methyltyramine; Ris = risperidone; TBMA = total barley maiya alkaloids.
