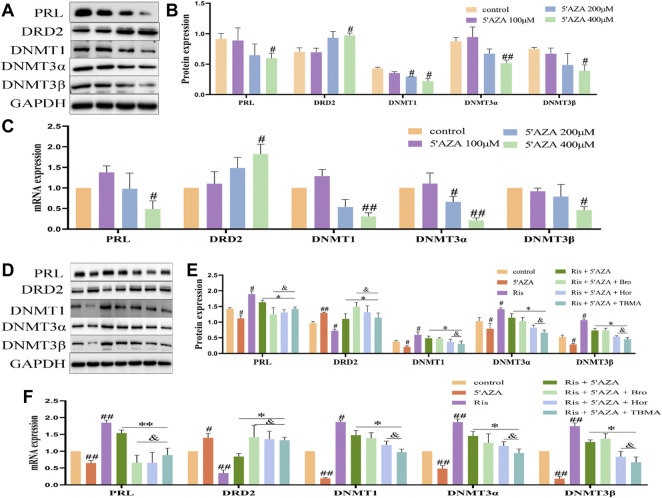
FIGURE 7.
The effects of TBMA and hordenine on DRD2 DNA methylation were enhanced by low DNMT expression levels. (A,B) PRL, DRD2, and DNMT protein expression by western blotting following treatment with different 5′AZA concentrations (n = 3). (C) PRL, DRD2, and DNMT mRNA expression by RT-PCR following treatment with different 5′AZA concentrations (n = 3; *p < 0.05 and **p < 0.01 versus the control group. (D,E) PRL, DRD2, and DNMT protein expression by western blotting following TBMA or hordenine treatment of MMQ cells (n = 3). (F) PRL, DRD2 and DNMT mRNA expression by RT-PCR following TBMA or hordenine treatment of MMQ cells (n = 3). Data are presented as the mean ± SD ( # p < 0.05 and ## p < 0.01 versus the control group; *p < 0.05 and **p < 0.01 versus the Ris group; & p < 0.05 versus the Ris +5′AZA group. 5′AZA = 5-Aza-2′-deoxycytidine; Hor = hordenine; Ris = risperidone; TBMA = total barley maiya alkaloids.

