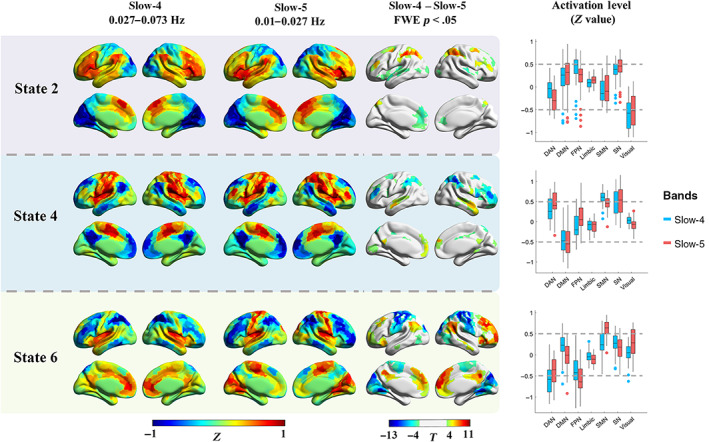
FIGURE 4.

The frequency‐specific effects between slow‐4 and slow‐5 within the HC group. The results of three states were presented, as the six CAP states were grouped into three pairs, and similar results were found within the pair. The first two columns show the cortical coactivations, and the color of each ROI indicates the activation deviation from its baseline level (Z‐value). Paired t‐test was performed for each state separately, and Bonferroni correction was used at the ROI level. The colorbar shows the T‐value, and regions with p <.05 (FWE corrected) were presented in the third column. The last column shows the activation level of the seven networks in slow‐4 and slow‐5, and each point represents an ROI's group averaged activation level from all 97 HC subjects
