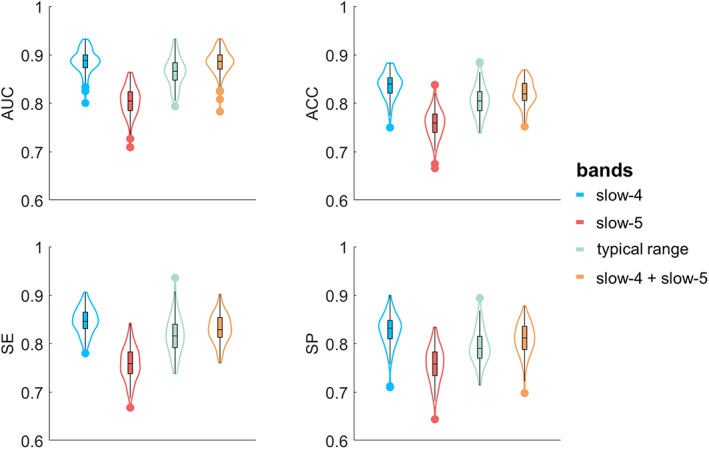
FIGURE 7.

The classification results of the 100 hold‐out repetitions. For the 97 HC subjects, 47 HC subjects were randomly selected to define the CAPs, and the remained 50 HC subjects and age/gender‐matched SZ patients were used for classification. This procedure was repeated 100 times, and each point within the violin plot represents the result of one repetition. ACC, accuracy; AUC, area under curve; SE, sensitivity, SP, specificity
