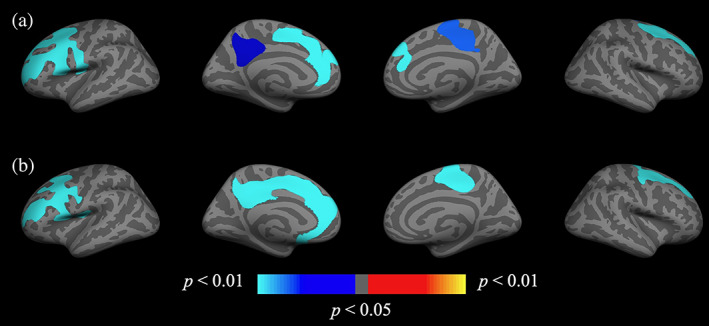
FIGURE 1.

Group (severe‐PTSD+ and severe‐PTSD−) by age interaction on cortical change. Whole‐brain vertex‐wise analysis of the severe‐PTSD × age interaction on annual percent change in (a) cortical thickness and (b) volume. Clusters remained significant following cluster correction (p < .05). Maps are presented on the inflated cortical surface of an average brain. Blue indicates a more negative association between age and annual percent change in the severe‐PTSD+ group, red/yellow indicates a positive relationship. Uncorrected maps can be found in the supplemental information (Figure S3). PTSD, posttraumatic stress disorder
