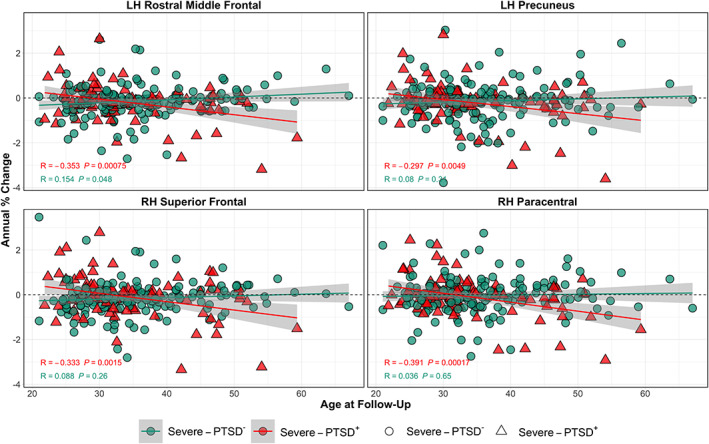
FIGURE 2.

Regions in which the annual percent change of cortical measures with age shows more rapid decline with severe‐PTSD. Plots of annual percent change in cortical thickness in the left rostral middle frontal gyrus and precuneus, and right superior frontal and paracental gyri by age. Scatter plots are color coded with red triangles and green circles corresponding to severe‐PTSD+ and severe‐PTSD−, respectively. PTSD, posttraumatic stress disorder
