
FIGURE 6.
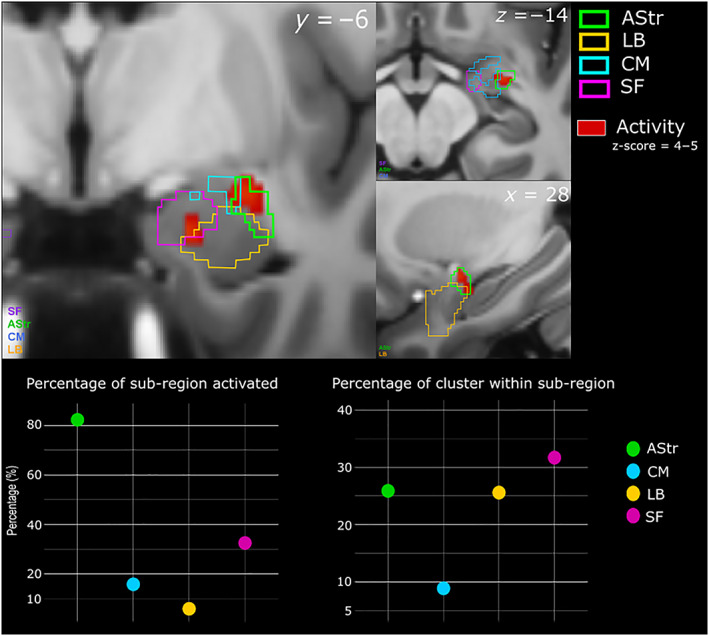
Subregion activations within the right amygdala, correlated with faster response time. Top panel shows activity in red with the subregional divisions overlaid in their respective colours. The bottom left graph shows the percentage of subregion activated. The bottom right graph shows the percentage of the cluster within each of the subregions. The axial (z), coronal (y) and sagittal (x) MNI coordinates are embedded in the relevant images. AStr, amygdalo‐striatal transition area; BL, basolateral; CM, centromedial; SF, superficial