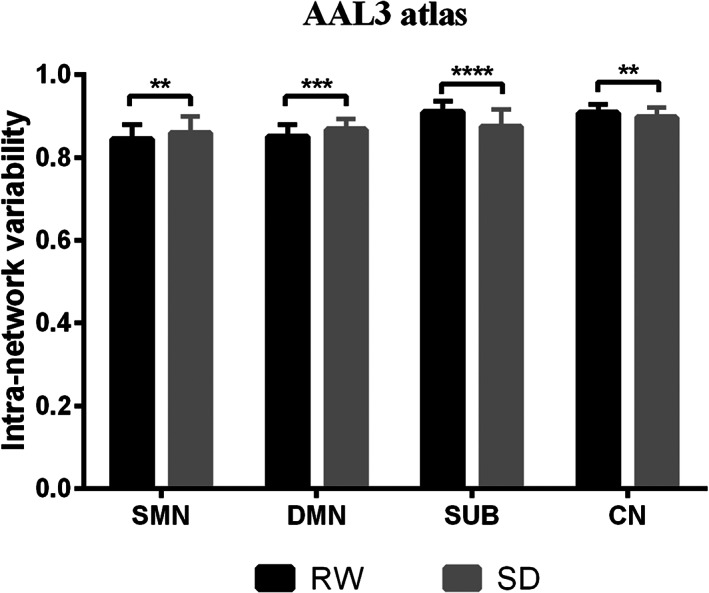
FIGURE 3.

Significant changes in intra‐network temporal variability between RW and SD with the AAL3 atlas. Subjects showed increased intra‐network temporal variability in DMN and SMN and decreased in SUB and CN after SD with false discovery rate (FDR) correction (p <.05). CN, cerebellum; DMN, default mode network; RW, rested wakefulness; SD, sleep deprivation; SMN, sensorimotor network; SUB, subcortical network. ****p <.0001. ***p <.001. **p <.01
