
FIGURE 4.
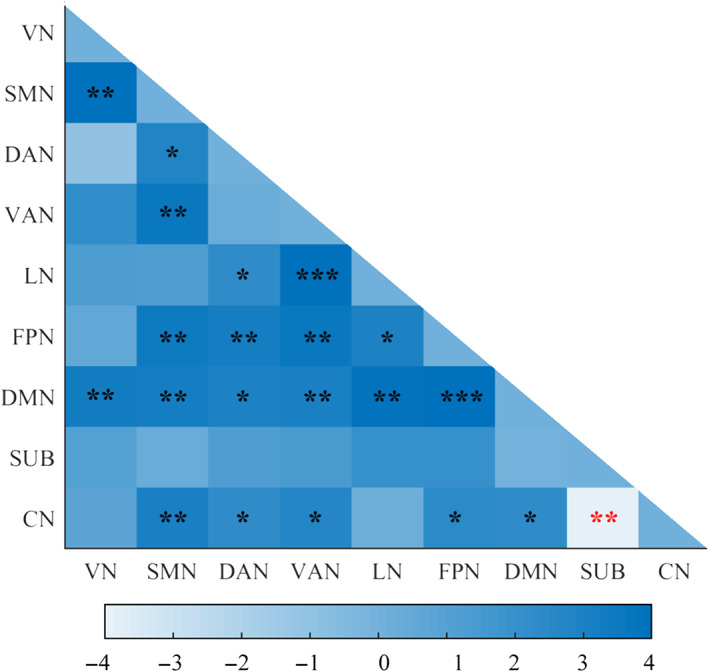
Significant changes in inter‐network temporal variability between RW and SD using the AAL3 atlas after FDR correction (p <.05). The color scale represents t value. The positive t values mean SD > RW; the negative t values mean SD < RW. Black asterisks (*) indicate the subnetwork pairs showing significantly increased inter‐network temporal variability after SD compared with RW. Red asterisks indicate the subnetwork pairs showing significantly decreased inter‐network temporal variability after SD compared with RW. ****p <.0001. ***p <.001. **p <.01. *p <.05. CN, cerebellum; DAN, dorsal attention network; DMN, default mode network; LN, limbic network; FDR, false discovery rate; FPN, frontal‐parietal network; SD, sleep deprivation; SMN, sensorimotor network; SUB, subcortical network; VAN, ventral attention network; VN, visual network; RW, rested wakefulness