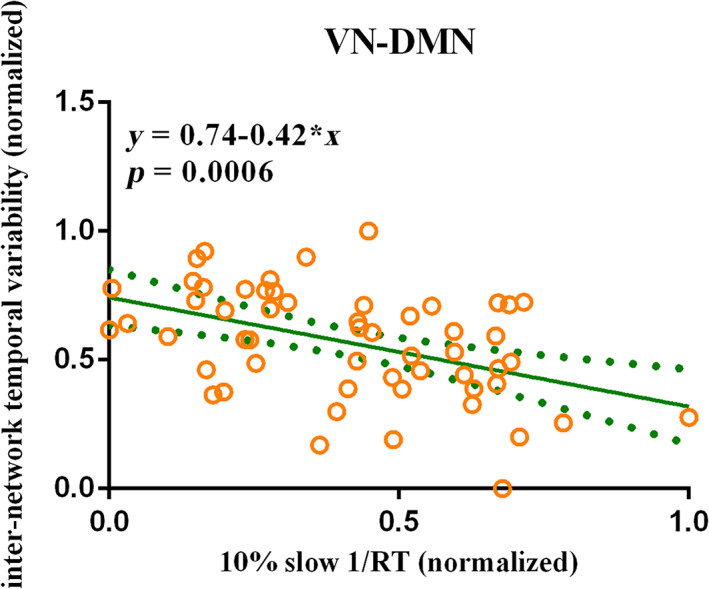
FIGURE 7.

The temporal variability is correlated with the performance of PVT in SD state. The 10% slow 1/RT showed significant negative correlation with the inter‐network temporal variability between VN and DMN in SD state after FDR correlation with the AAL3 atlas (β = −.42, p = 5.57 × 10⁻⁴) following the stepwise regression analysis. Considering the dimensional differences among temporal variability and performance measures, the 10% slow 1/RT and the inter‐network temporal variability between VN and DMN were normalized. The green solid line indicated the linear regression of the correlation. The green dotted line indicated the error bars. DMN, default mode network; FDR, false discovery rate; PVT, psychomotor vigilance test; RT, reaction time; SD, sleep deprivation; VN, visual network
