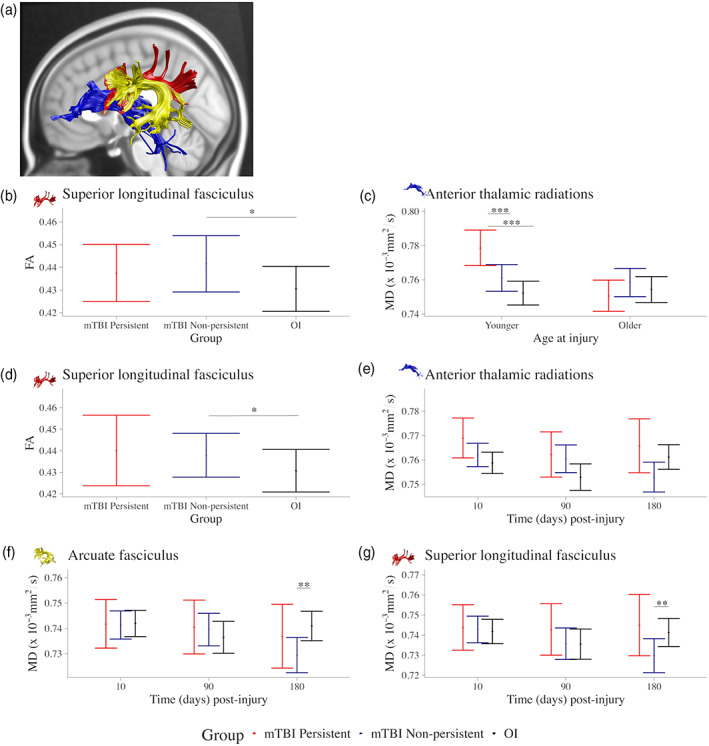
FIGURE 3.

Significant effects involving symptom status group based on child repot on DTI metrics. Graphs illustrating differences and their effect magnitudes in (a) regional tract metrics among symptoms status groups based on child report for (b) FA of the superior longitudinal fasciculus (main effect of group) and (c) MD of the anterior thalamic radiation (group by age at injury interaction), and among symptoms status groups based on parent report for (d) FA of the superior longitudinal fasciculus (main effect of group) and MD of the (e) anterior thalamic radiations, (f) arcuate fasciculus, and (g) superior longitudinal fasciculus (group by time interaction). Follow‐up analyses examined group differences within the context of the final model and for the 10th and 90th percentile of age at injury. Standardized effect size was computed for group (mTBI—OI) differences using model estimates for Cohen's d effects sizes with 95% confidence interval range excluding zero are illustrated using *, **, and *** for small, medium, and large effect magnitudes. Complete results are provided in Table S3.
