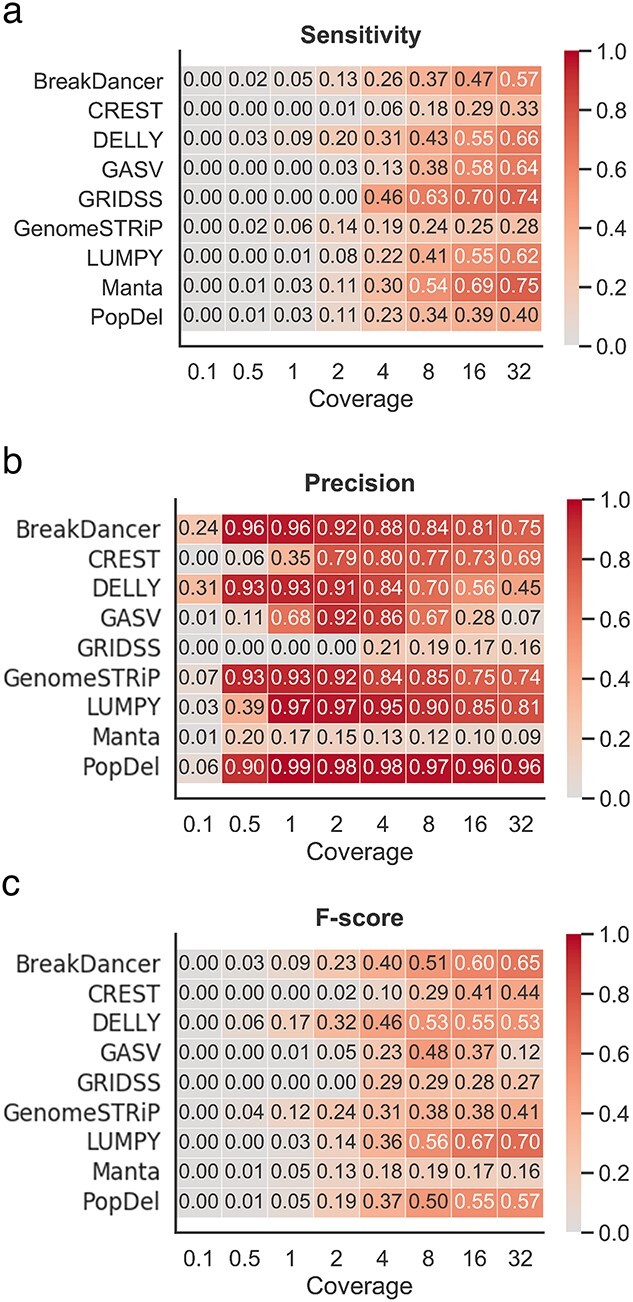
Figure 4.

Performance of SV detection tools on low- and ultralow-coverage mouse data. (A) Heatmap depicting the sensitivity based on the 100 bp threshold across various levels of coverage. (B) Heatmap depicting the precision based on the 100 bp threshold across various levels of coverage. (C) Heatmap depicting the F-score based on the 100 bp threshold across various levels of coverage.
