Figure 4.

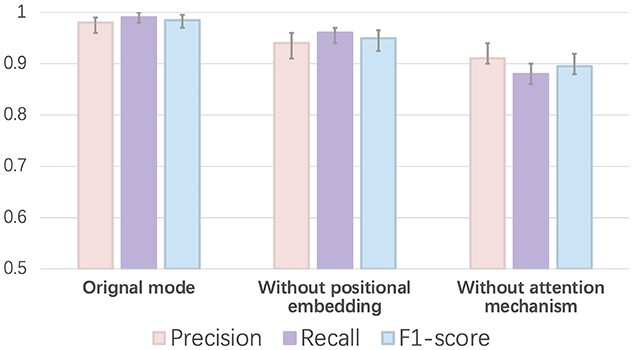
The 10-fold cross-validation performance on the training set. X-axis: training with different methods. Y-axis: the value of each metric (precision, recall and F1-score).

The 10-fold cross-validation performance on the training set. X-axis: training with different methods. Y-axis: the value of each metric (precision, recall and F1-score).