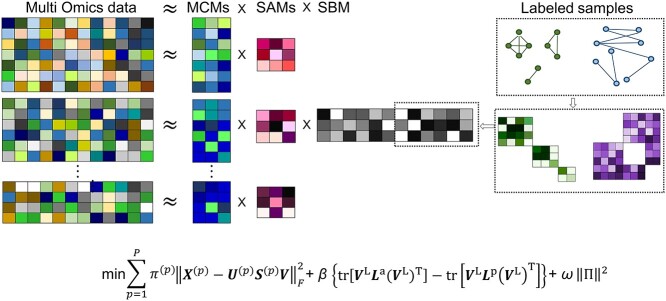
Figure 4.
The CBP-JMF approach modified from figure in ref. 84.  ; β and ω represent the importance of the Laplacian regularization of the graph and the weight constraint
  , respectively. V is divided into
  and
and  according to input data; L and UL mean ‘labeled’ and ‘unlabeled’ samples, respectively.
  (
( ) and
) and  (
( ) are Laplacian matrices of
  and
and  , respectively.

