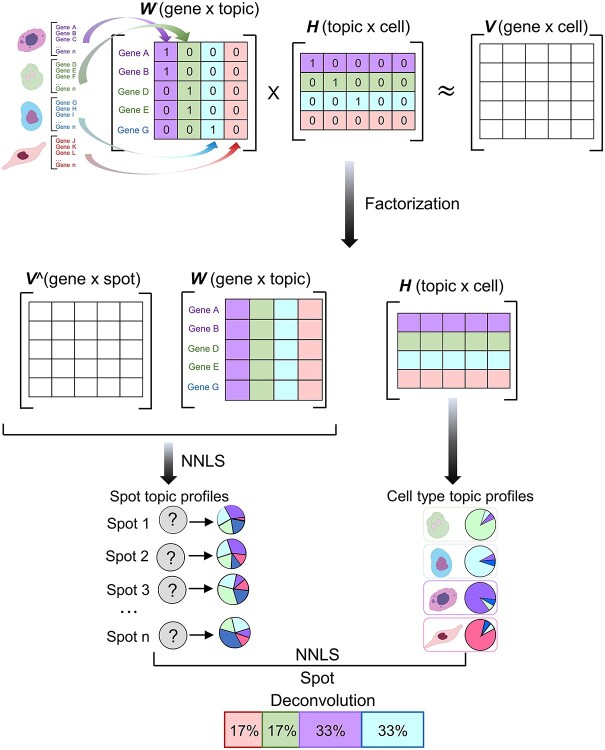
Figure 5.
SPOTlight approach modified from figure in Ref. 90. Initialize the basis and coefficient matrices, W and H, respectively, with prior information for the count matrix V of the scRNAseq data and the set of marker genes of the identified cell types. Assume that the number of topics k is equal to the number of cell types in the data set. The columns of W are initialized with the marker genes of the cell type associated with that topic; the rows of H are initialized with each cell’s membership in the associated topic. Next, matrix decomposition is performed from the gene distribution of each topic in W and the topic profile of each cell in H. W is used to map the ST data V^ by the non-negative least squares (NNLS) method to obtain H^. The H^ column represents the topic profile of each spot. Then, we aggregate all cells of the same cell type to obtain cell type-specific topic profiles from the H matrix obtained from the scRNAseq data. Finally, NNLS is used to find the combination of topics by cell type similar to the topic profile of each spot.

