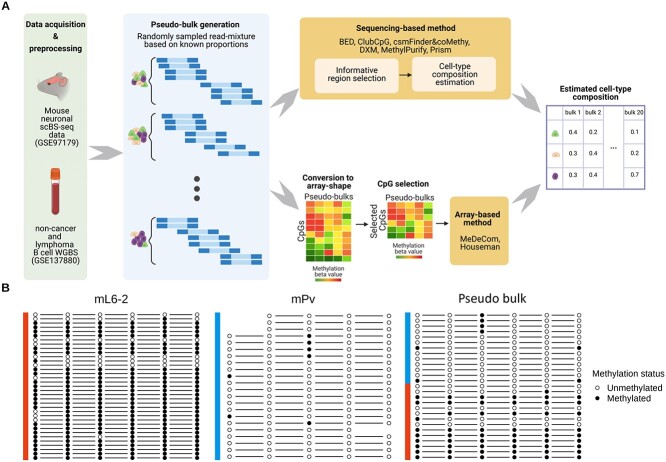
Figure 1.
Schematic overview of our cell-type deconvolution benchmarking. (A) Overall scheme of cell-type deconvolution benchmarking. We synthesized in silico cell mixtures called pseudo-bulks by mixing up reads randomly sampled from mouse neuronal scBS-seq dataset and tumor WGBS dataset, respectively. Sequencing-based cell-type deconvolution methods directly take sequencing data and select informative CpG sites (informative regions) supposedly related to cell-type heterogeneity (upper row pipeline). Then, cell-type proportions are estimated from selected CpGs. For array-based cell-type deconvolution methods, we converted sequencing data into array shape with pre-identified CpGs and the methods estimated cell-type compositions from the array (bottom row pipeline). (B) Example of an informative region showing a cell-type-specific methylation pattern in mouse neuronal data (chr1:75244319-75244379). Methylation pattern of reads (each row) overlapping with a specific region was extracted from three different samples, two pure cell-type samples (mL6-2 and mPv) and a pseudo-bulk sample comprised of these cell types. Some missing methylation patterns in the figure occurred owing to the CpG sites not covered by each read. In this region, the majority of reads from mL6-2 are fully methylated, whereas most reads from mPv show a fully unmethylated pattern.

