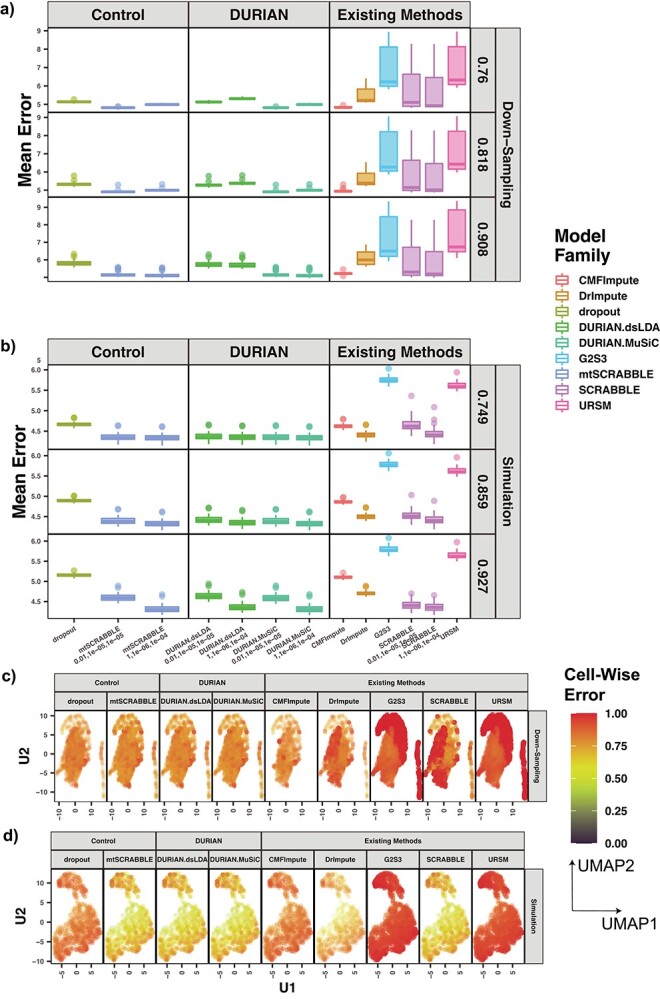
Figure 2.

Mean error of imputation benchmarks. (A-B) Mean error (log RMSE) of imputation for both synthetic data strategies: downsampling and simulation. For each strategy, the mean sparsity (percentage of zeros in the unimputed data) of all replicates corresponding to each of three values for the strategy-specific dropout parameter is shown in the 2nd level vertical label:  (downsampling),
  (simulation). The x-axis is arranged into three method categories (shown in top label): control, DURIAN, existing methods. Control methods include dropout: unimputed data and mtSCRABBLE: the DURIAN algorithm where the deconvolution map is permanently set according to the true bulk celltype percentages. Both dsLDA and NNLS (MuSiC) deconvolution approaches are included for DURIAN benchmarks. Two sets of values for the ADMM parameters of the SCRABBLE/DURIAN objective are provided for DURIAN, SCRABBLE and mtSCRABBLE:
  and
and  . (C) Scatter plots of a UMAP embedding for a replicate of the downsampling strategy at sparsity
  , color corresponds to the centered and scaled logistic transformation of cellwise RMSE. (D) Scatter plots of a UMAP embedding for a replicate from the simulation strategy at mean sparsity
  . DURIAN parameters for C–D are
  .
.
