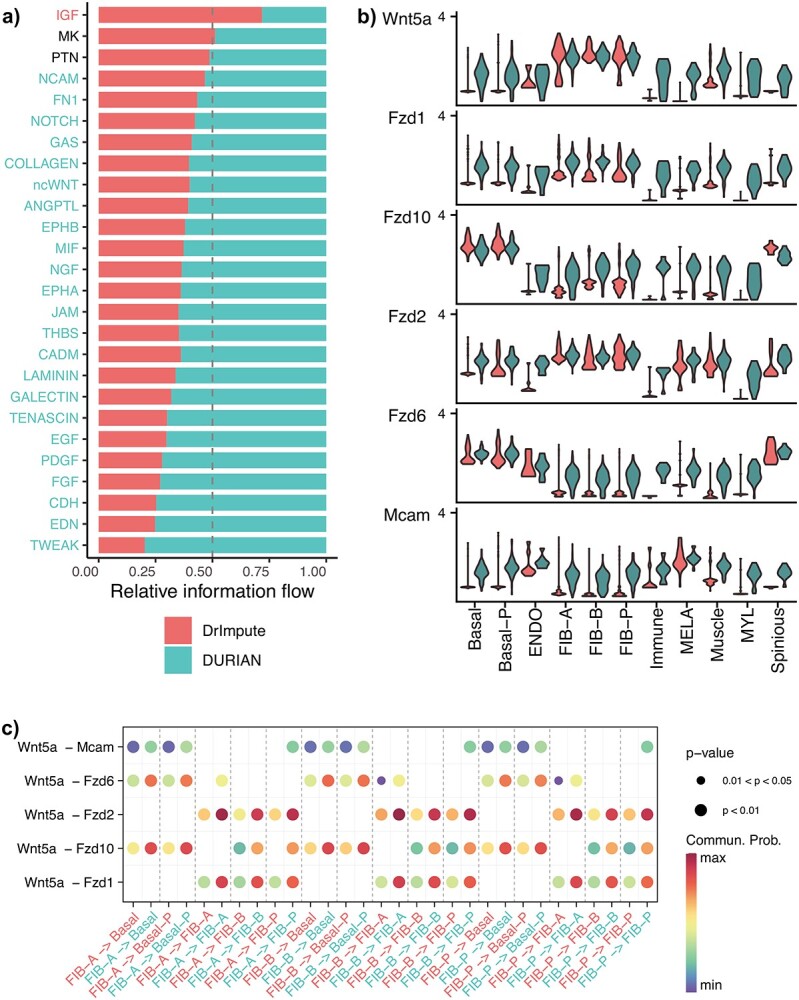
Figure 5.

Quantitative comparison of imputation via DURIAN and DrImpute on mouse embryonic skin . (A–C) CellChat comparative analysis of signaling in mouse E13.5 embryonic skin. (A) Relative information flow (higher is better) on each pathway (for which significant interactions were detected), defined as the sum of communication probability among all pairs of cell groups in the inferred network. (B) Violin plots for markers in the noncanonical Wnt pathway after imputation by either DrImpute (in red) or DURIAN (in green), units of expression are log(counts+1). (C) Bubble plots showing the communication probability from individual fibroblast clusters to individual basal cell clusters. Colors on the x-axis labels denote imputation by either DrImpute (in red) or DURIAN (in green). For each row, adjacent bubble pairs within a set of vertical dashed lines represent signaling detected by DrImpute versus DURIAN.
