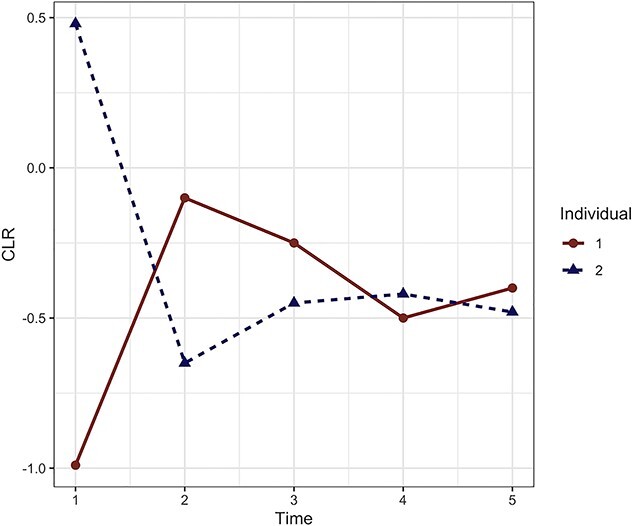
Figure 3.

CLR trajectories for two individuals over five time points for a given taxon. The CLR is calculated per time point and per individual (i.e. per sample). For individual 1, the CLR abundance is greater than individual 2 at time 2, 3 and 5. However, we may not observe the same trend if we had access to the (true) absolute counts, as the geometric means are not directly comparable between samples. Similar problems arise when we consider multiple time points to assess differential abundance between two groups over time or between different time points within the same group.
