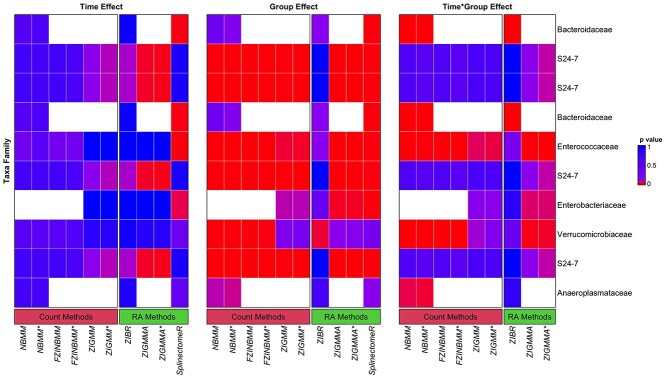
Figure 7.
VREfm study. P-values for time, group and their interaction effects for the ten most abundant taxa. P-values range from < 0.05 (red) to 1 (blue). White cells indicate methods that produced a numerical error. The most prominent effect in these taxa is the group effect, as expected. We observed group differences in Bacteroidales, Enterococcaceae and Enterobacteriaceae families. Significance level = 0.05, ‘*’ indicates a model fitted with a AR within-subject correlation structure.

