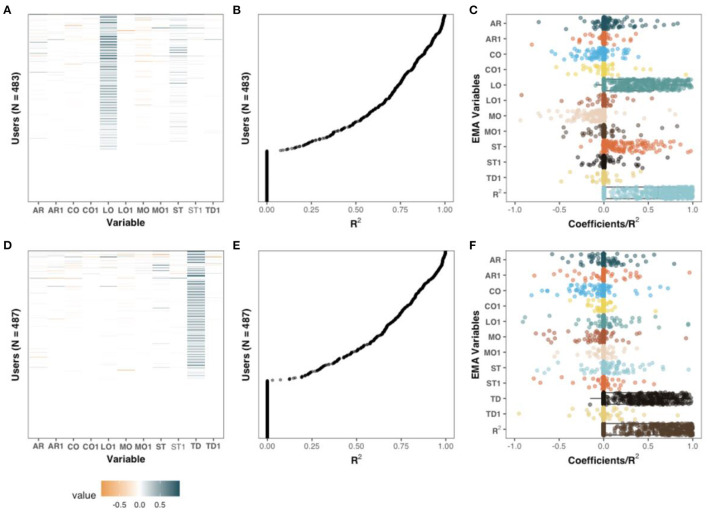
Figure 4.
Coefficients of penalized regression models with TD (A–C) and LO (D–F) as dependent variables. Sequences in which the dependent variable had no variability were excluded from this analysis. The coefficients and R2 of the individualized models on the Y-axis of (A,B) and (D,E) are aligned. Left column: standardized coefficients uniquely estimated for each sequence. Middle column: the amount of variance explained, measured with R2, for each unique sequence. Right column: The adjusted coefficients of (A,D), and R2, of (B,E) are presented with box and dot plots.

