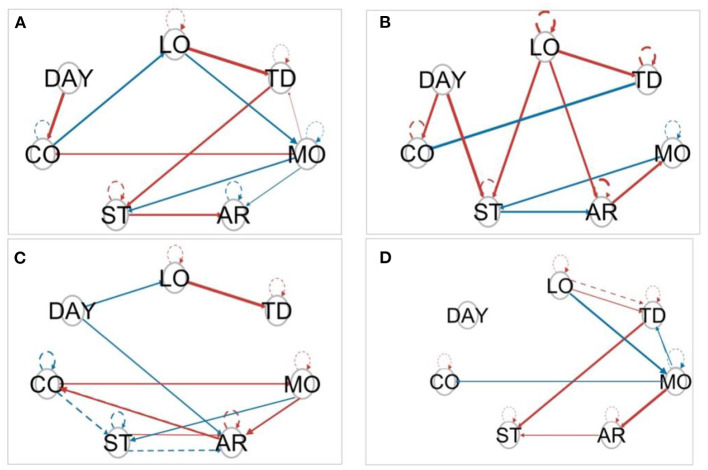
Figure 5.
Model estimated by S-GIMME by the same four (A–D) individuals from Figure 1. Solid lines represent a contemporaneous effect (lag = 0), and dashed lines represent lagged effects (lag = 1). The circles represent the variables included in the study. Arrows indicate the direction of the relationship. Red arrows indicate positive regression paths and blue lines indicate negative regression paths.

