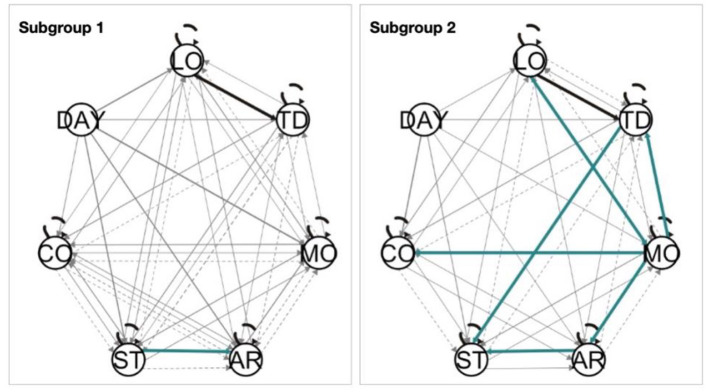
Figure 6.
Two subgroups were identified by S-GIMME (left: N = 19, right: N = 13). The black lines represent the paths present at the group level (e.g., paths shared by both subgroups), the green lines represent the paths present at the subgroup level, and the gray lines represent the paths at the individual level. Solid lines represent contemporaneous effects, and dashed lines represent lagged effects. Arrow heads indicate the direction of the relationship.

