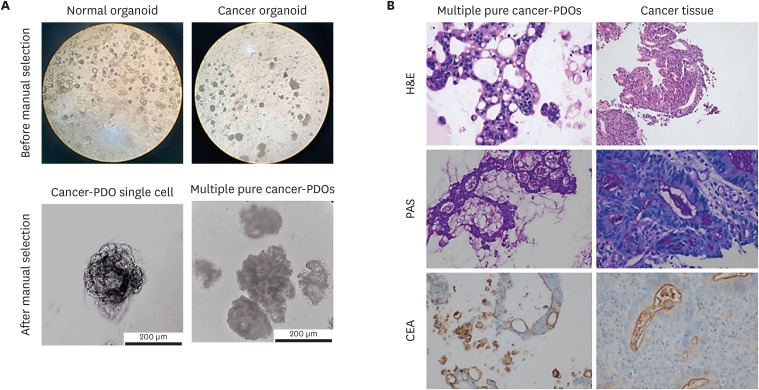
Fig. 2. Microscopic images of PDOs before and after staining. (A) Unstained PDOs before (top left; generated from normal tissue, top right; generated from cancer tissue, original magnification, ×40) and after manual selection (bottom left; PDO single cell, bottom right; multiple PDOs). (B) Comparative histological and IHC images of the biopsy specimens and pure gastric cancer-PDOs. On H&E stain, histologic features of the gastric cancer-PDO (top left; original magnification, ×400) are similar to those of original tumor tissue from the patient (top right; original magnification, ×100). The intraluminal mucin from gastric cancer-PDO (middle left; original magnification, ×200) and original tumor tissue (middle right; original magnification, ×400) is highlighted by PAS staining. CEA expression as apicoluminal pattern is the same in gastric PDO (bottom left; original magnification, ×200) and original tumor tissue (bottom right; original magnification, ×400).
PDO = patient-derived organoid, IHC = immunohistochemistry, H&E = hematoxylin and eosin, PAS = Periodic acid-Schiff, CEA = carcinoembryonic antigen.

