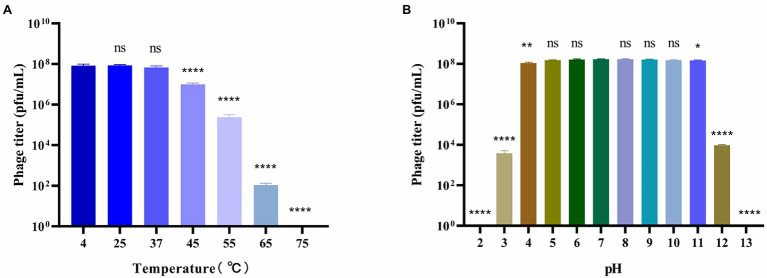
Figure 2.
Stability of bacteriophage BUCT603. (A) Thermal stability of the phage treated with different temperature for 12 h; (B) pH stability of the phage treated with different pH for 12 h. Data are shown as the mean ± SD, ****p < 0.0001, **p < 0.01 and *p < 0.05 indicates a significant difference between this group and the control.

