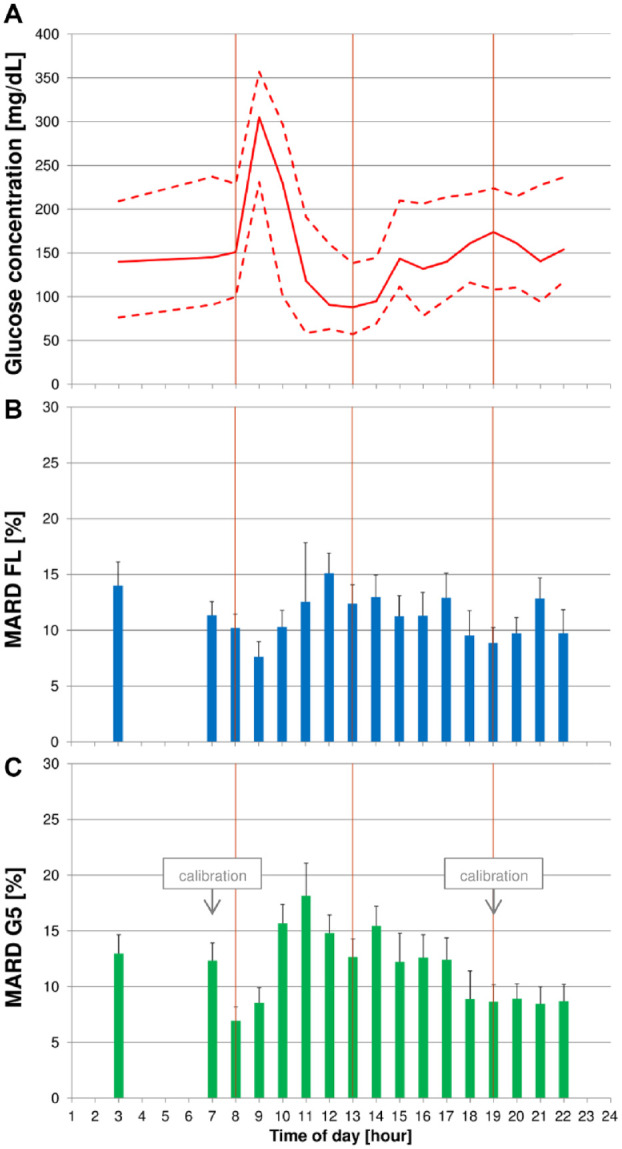
Figure 2.

(A) Median blood glucose (BG) concentrations (continuous line) with 10th and 90th percentiles (dashed line) on days with induced glucose excursions. (B + C) Mean absolute relative differences (MARD) with upper bounds of 95% confidence intervals for FreeStyle Libre (FL) (B) and Dexcom G5 (G5) (C). Glucose excursions were induced after breakfast by providing a carbohydrate-rich breakfast and delaying and increasing the corresponding insulin dose. Vertical lines indicate scheduled intake times for breakfast, lunch, and dinner.
