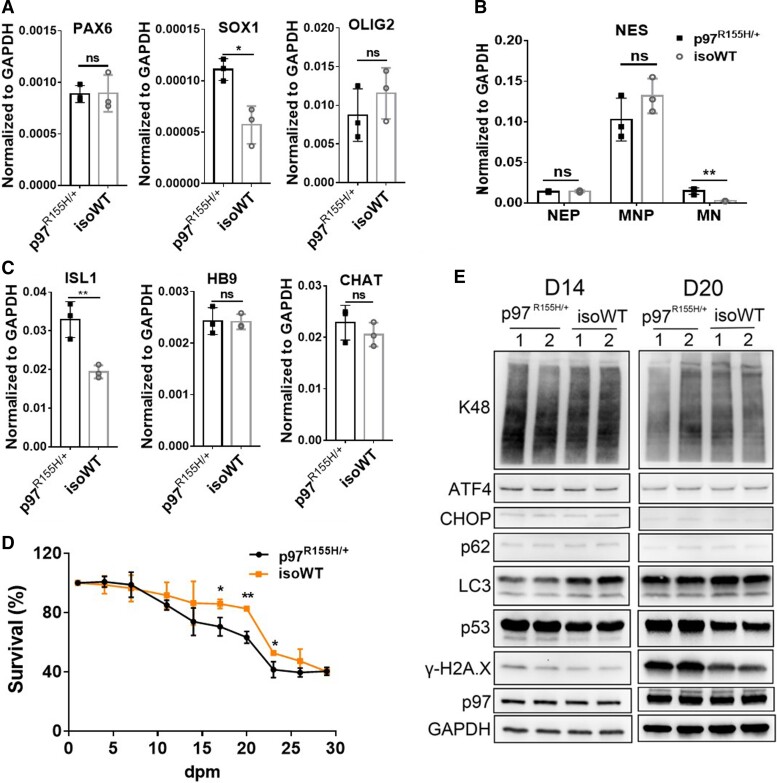
Figure 2.
Comparison of MN differentiation of p97R155H/+ and isoWT cells. (A-C) qPCR analysis of specific markers at different stages of MN induction. PAX6 and SOX1 were detected at 6 dpi (NEP stage). Olig2 was detected at 12 dpi (MNP stage). ISL1, HB9 and CHAT were detected at 14 dpm (mature MNs). NES was detected at 6, 12and 14 dpm. (D) Cell survival curves during MN maturation. Data represent mean ± SD, n = 3. *: P < 0.05, **: P < 0.01 according to unpaired t-test. (E) Western blot of D14 and D20 MNs. FC indicates the average fold change (ratio of p97R155H/+ to isoWT). Each data point represents an independent differentiation of the same iPSC line.

