Figure 3.
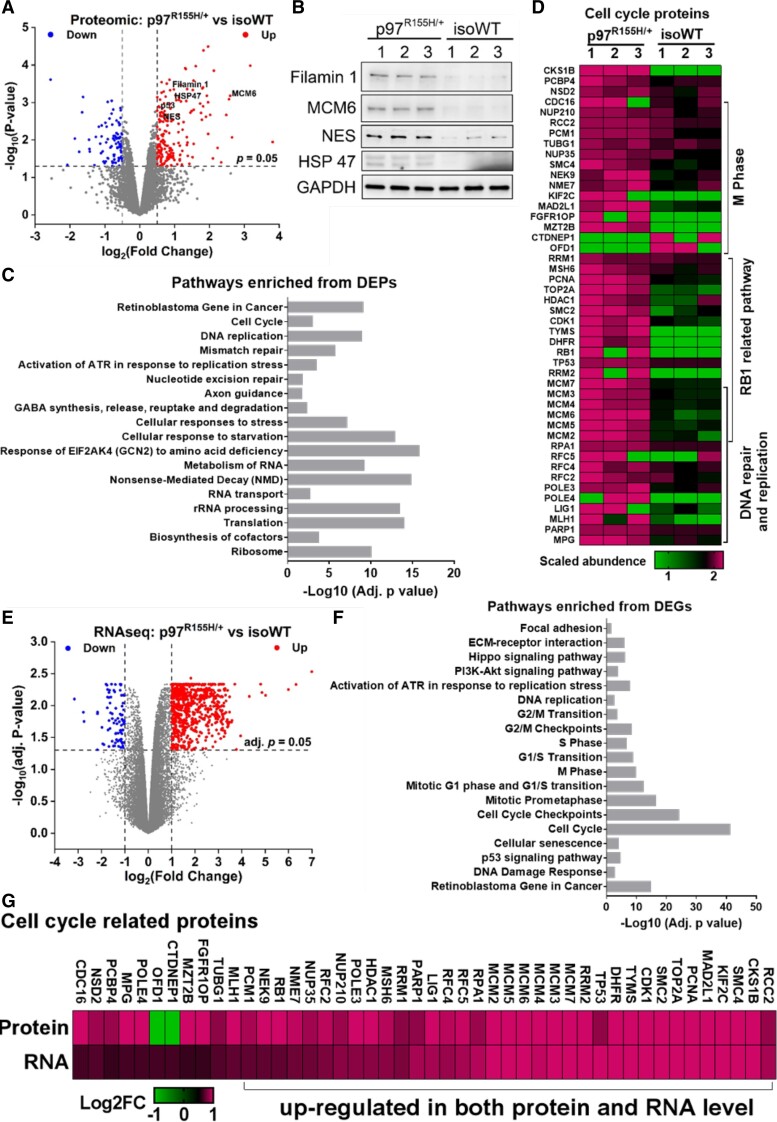
Proteomic and transcriptomic analysis on D14 MNs. (A) Volcano plot displaying the proteomic changes in p97R155H/+ MNs, log2 (Fold Change) indicates the logarithm to the base 2 of fold change, n = 3. (B) Western blot showing increases in NES, MCM6, Filamin 1 and HSP47 are consistent with proteomic data. FC indicates the average fold change in (p97R155H/+/isoWT). (C) Functional enrichment analysis on the proteins affected by p97R155H/+. (D) Heatmap displaying the scaled abundance of DEPs related to cell cycle. (E) Volcano plot displaying the transcriptomic changes in p97R155H/+ MNs. (F) Functional enrichment analysis on the DEGs identified from p97R155H/+ MNs. (G) Heatmap representation of a comparison between RNA-seq and proteomics for cell cycle-related DEPs. Log2FC represents log2 (Fold Change).

