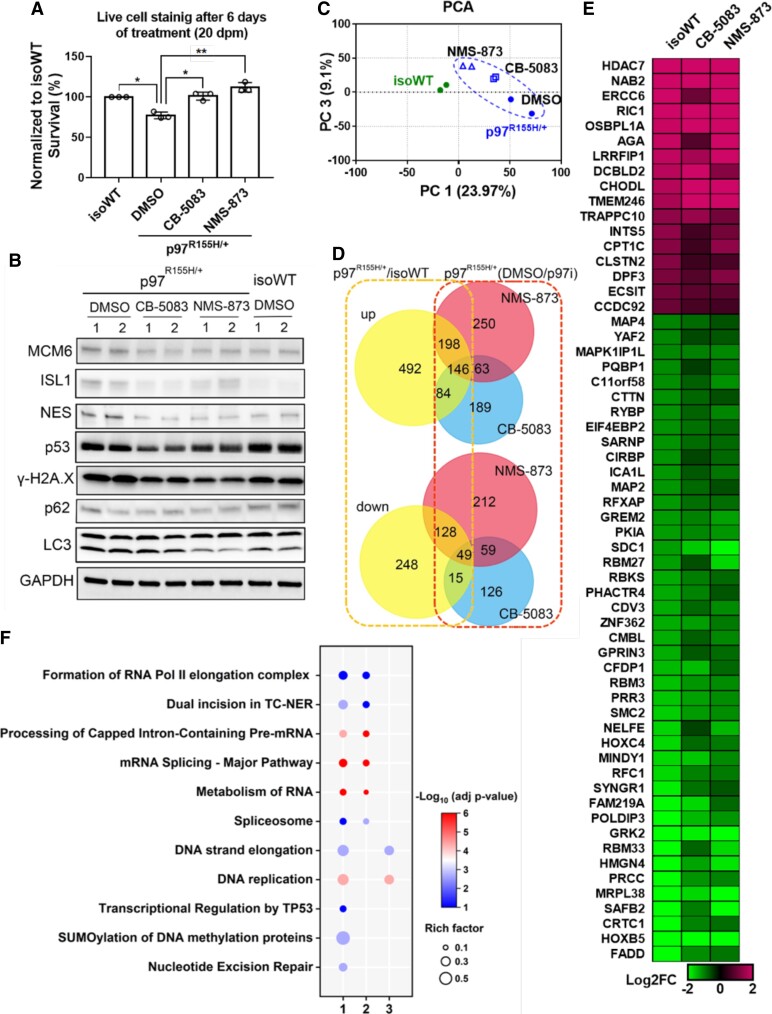
Figure 5.
p97 inhibitors rescue neuron loss and proteomic changes in p97 R155H/+ MNs. (A) Live cell staining and western blots of cells treated with 400 nM of CB-5083 or 400 nM of NMS-873 for 6 days shows reduced neuron loss (A, each data point represents an independent differentiation of the same iPSC line, n = 3, *: P < 0.05, ** P < 0.001 according to unpaired t-test.) and reversal of dysregulated protein levels (B) in p97R155H/+ MNs at 20 dpm. FC indicates the average fold change. (C) PCA of proteomics showing the separation between isoWT MNs treated with DMSO and p97R155H/+ MNs treated with DMSO or p97 inhibitors. (D) Venn diagram showing that p97 inhibitor treatments prevent changes in proteins which were elevated (up) or reduced (down) in D20 p97 MNs. Numbers inside Venn diagram indicate the DEPs in different conditions. (E) Heatmap showing that DEPs with |Log2FC|>1 were not seen upon treatment with p97 inhibitors in D20 p97R155H/+ MNs. (F) Functional enrichment analysis on DEPs identified from D20 p97R155H/+ MNs (1), and the DEPs which are reversed (2) or not reversed (3) by p97 inhibitors.

