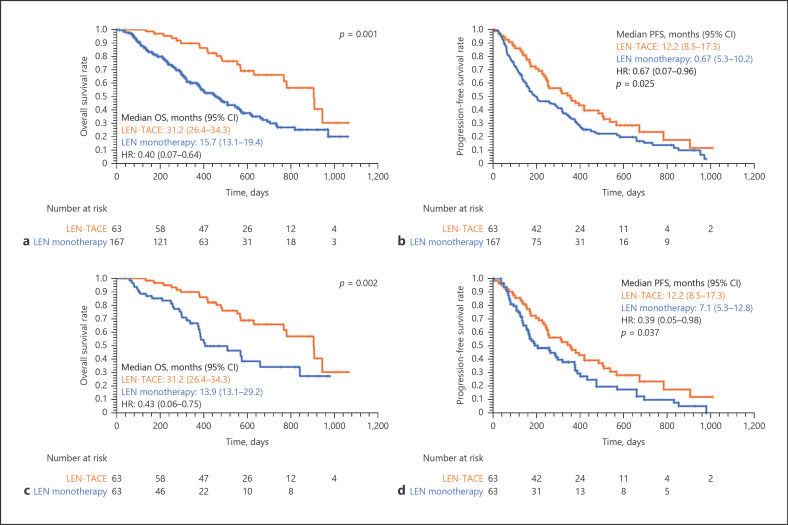
Fig. 2.
Kaplan-Meier curves for OS among all patients (a), PFS (b) among all patients, OS in the PSM cohort (c), and PFS in the PSM cohort (d). The median OS for the LEN-TACE group was 31.2 (26.4–34.3) months, and this for the LEN monotherapy group was 15.7 (13.1–19.4) months, respectively (p = 0.001, a). The median PFS for the LEN-TACE group was 12.2 (8.5–17.3) months, and this for the LEN monotherapy group was 6.7 (5.3–10.2) months, respectively (p = 0.025, b). The median OS for the LEN-TACE group was 31.2 (26.4–34.3) months, and that for the LEN monotherapy group was 13.9 (13.1–29.2) months, respectively (p = 0.002, c). The median PFS for the LEN-TACE group was 12.2 (8.5–17.3) months, and this for the LEN monotherapy group was 7.1 (5.3–12.8) months, respectively (p = 0.037, d). LEN, lenvatinib; TACE, transcatheter arterial chemoembolization; OS, overall survival; PFS, progression-free survival.

