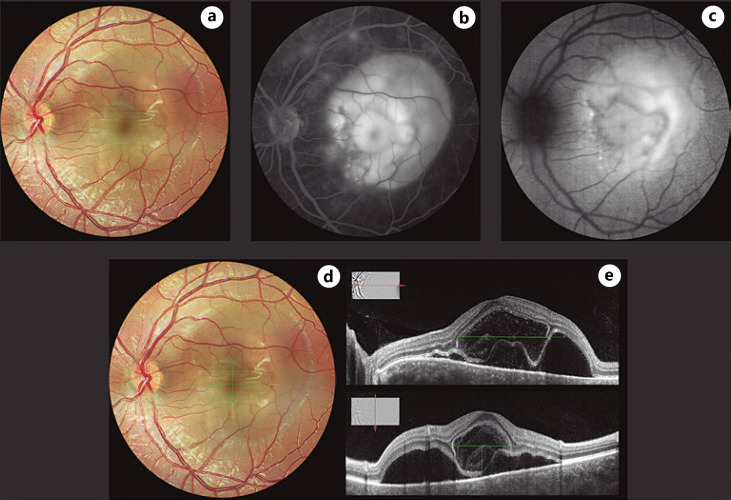
Fig. 1.
a) Clinical picture of the posterior pole, b) corresponding fluorescein angiogram and c) autofluorescence image showing serous and bacillary layer detachment. Measurements of the bacillary layer detachment estimated in the fundus image: 3.39 × 2.29 mm (d) and OCT -horizontal (3,391 μm) and vertical (2,209 μm) diameters- (e), centered around the fovea.

