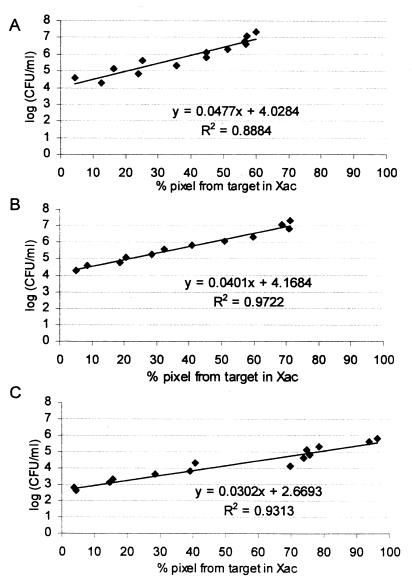
FIG. 3.
Linear regressions for calibration of PCR products generated from the target sequence in serial dilutions of X. axonopodis pv. citri (Xac) in grapefruit leaves and from pGXIS at concentrations of 1.5 (A), 0.15 (B), and 0.015 (C) pg/μl. Each point represents a measure of the percentage of the pixel density from the PCR product obtained from the target sequence (222 bp) relative to the total pixel density generated from the target and pGXIS (400 bp) PCR products. Also shown are equations that resulted from a linear-regression analysis.

