
Fig. 4. RGS3 diminishes KRASG12C activation in cancer cells.
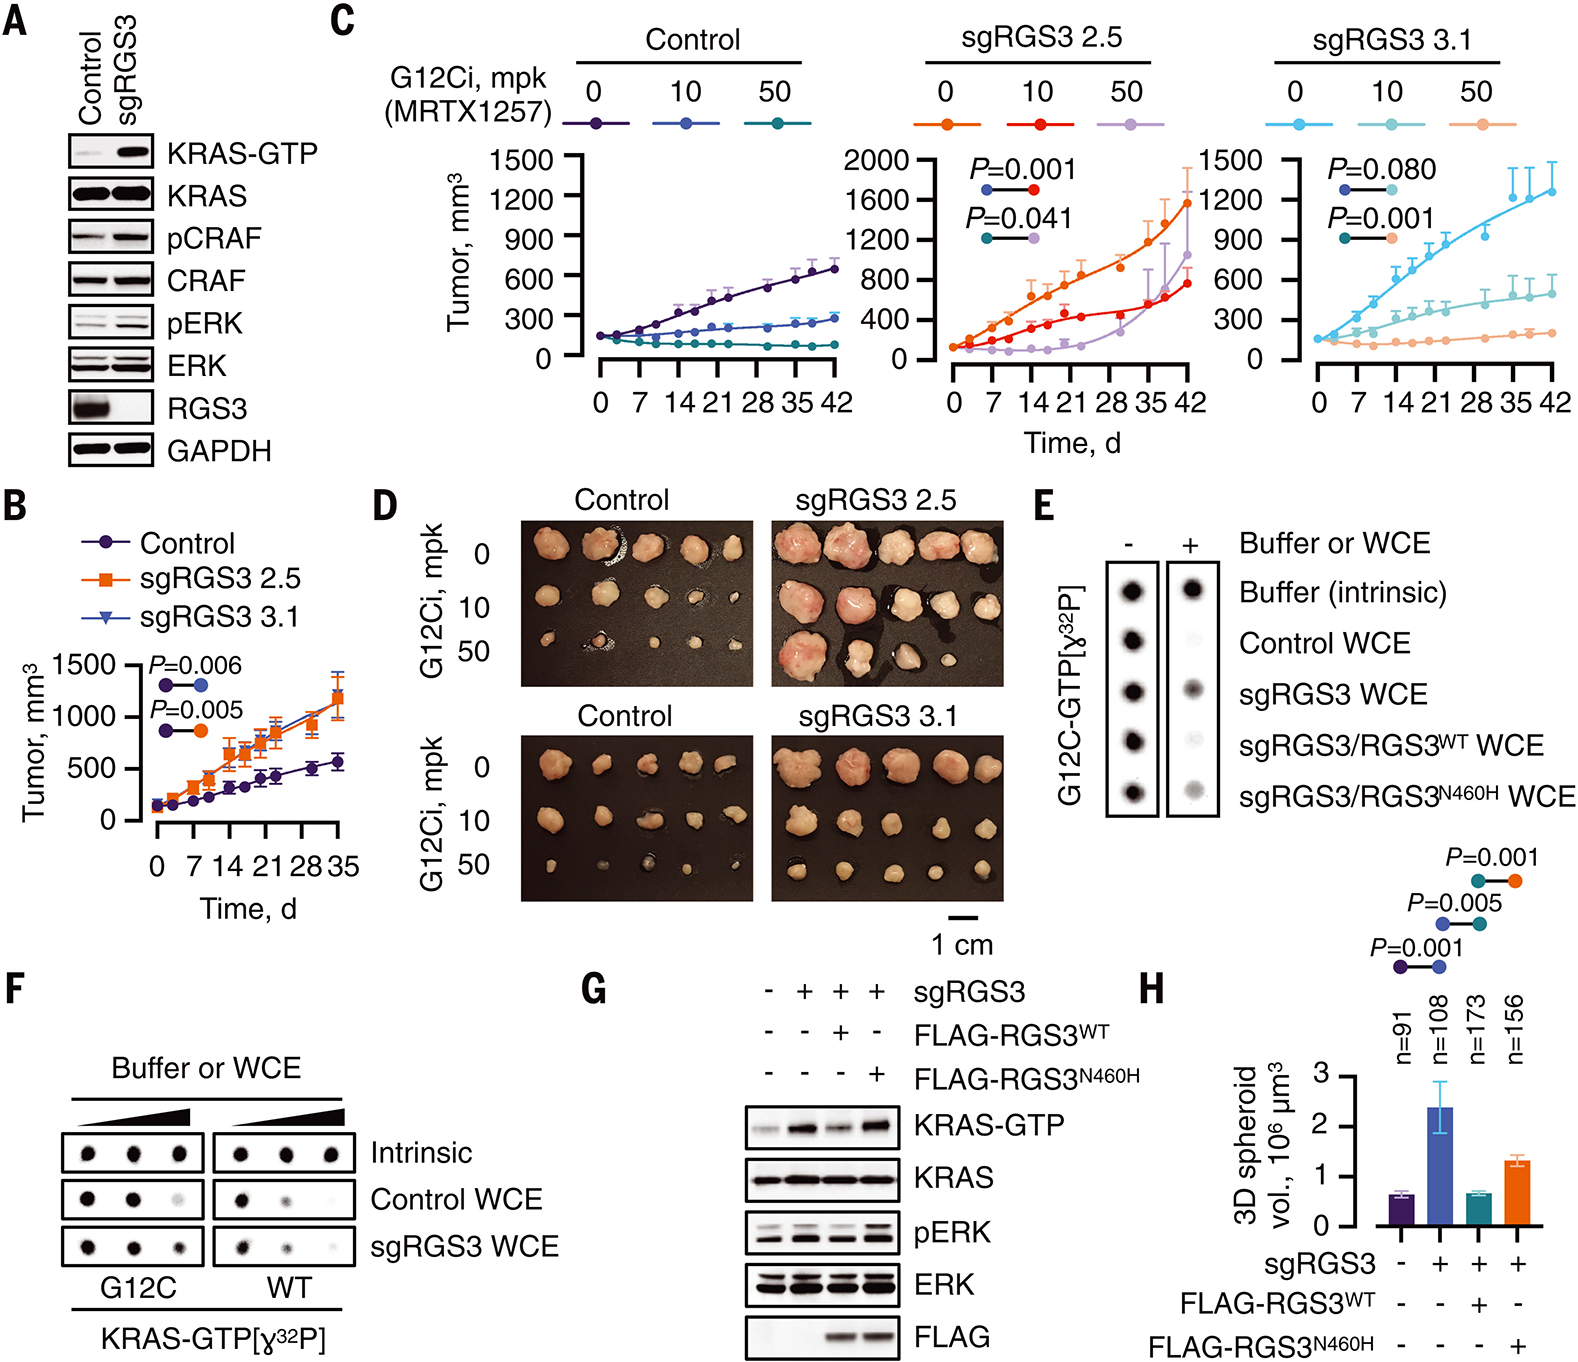
(A) WCE from control or RGS3-null H358 cells were immunoblotted to determine the effect on the indicated signaling intermediates. A representative of at least three experimental repeats is shown. (B) Control or RGS3−/− clones were implanted in athymic mice to determine the effect on tumor growth (n=10 for control and n=5 for each sgRGS3 clone). Mean ± s.e.m and two-tailed p values are shown. (C, D) Mice bearing control or RGS3−/− xenografts were treated as shown to determine the effect on tumor growth (n=10 for the control and n=5 for each sgRGS3 clone). Two-tailed p values (C) and endpoint tumor volumes (D) are shown. (E) Purified KRASG12C was loaded with GTP[ɣ32P] and assayed for GTP-hydrolysis in the absence or presence of extracts (0.4 μg/μL) from control and RGS3−/− cells as well as extracts from RGS3−/− cells engineered to re-express WT or N460H mutant RGS3. (F) Purified KRASWT or KRASG12C proteins were loaded with GTP[ɣ32P] and assayed for hydrolysis in the absence (intrinsic) or in the presence of extracts (WCE) from control or RGS3−/− cells (0, 0.1, 0.2 μg/μL). (G) WCE from the indicated cell lines were evaluated by RBD-pulldown to determine the amount of active KRAS. (H) The cells were cultured as 3D tumor spheroids in collagen I-containing medium for 17 days. The spheroid volumes were determined from representative images.