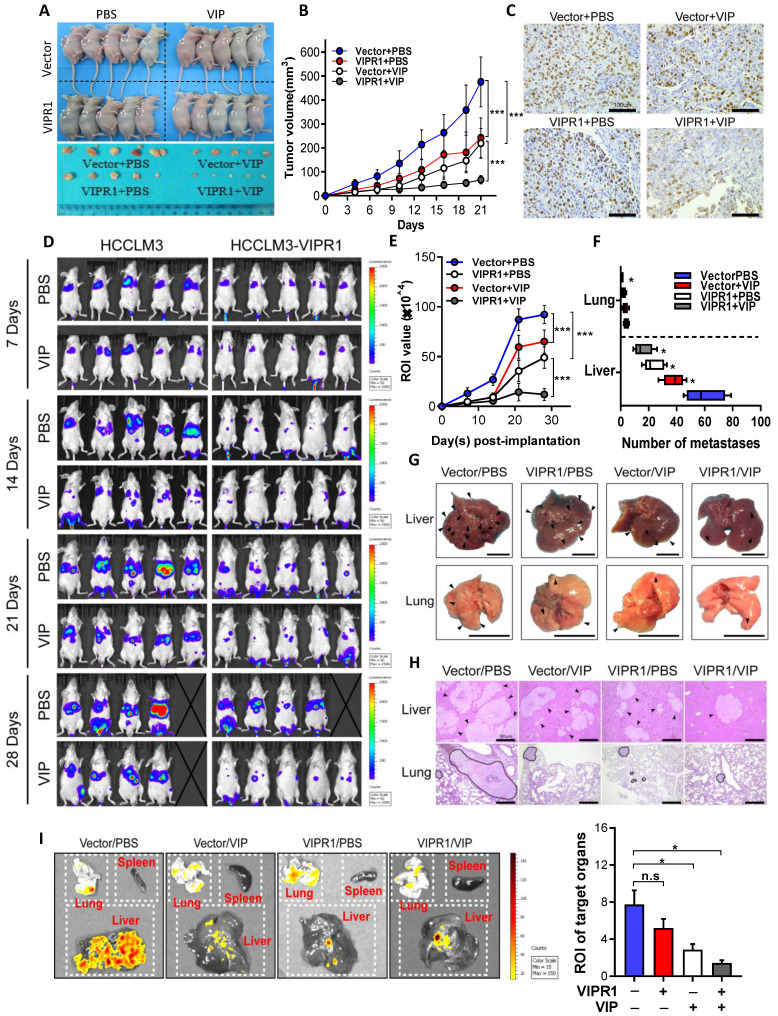
Figure 3.
In vivo activation of VIPR1 by VIP treatment suppresses HCC growth and distant metastasis. (A-C) HCCLM3-VIPR1 cells with VIRP3 overexpression and HCCLM3-Vector cells with vector expression were subcutaneously implanted in the backs of nude mice (5×10⁶ cells/mouse; n=5 in each group), followed by VIP (i.v., 300µg/kg) or vehicle treatment. The mice were sacrificed at Day 21. The volume of tumor masses is shown in panel A. Tumor size was measured twice per week in 3 continuous weeks and is shown in panel B. Representative Ki-67 staining of xenograft sections in each group (scale bars, 100 μm) is shown in panel C. (D-I). Luciferase labeled Vector and HCCLM3-VIPR1 cells were intravenously injected to NCG mice (1×10⁶ cells/mouce; n=5 in each group), followed by VIP (i.p., 300µg/kg) or equal volume vehicle treatment. Bioluminescence imaging was subsequently used to visualize and quantify metastatic foci for 4 weeks and is shown in panel D. Photon flux of metastatic foci in Region of Interest (ROI) were quantified by recording bioluminescence value at week 1, 2, 3 and 4, and is shown in panel E. Number of metastatic foci in liver and lung were examined and counted at week 4 after sacrificing the mice and is shown in panel F. Metastases in targeted organs are indicated by arrows (scale bars, 1cm) and shown in panel G. Representative H&E staining of liver and lung sections in each group (scale bars, 500μm) is shown in panel H (metastases were surrounded by dotted line). Quantification of metastases in spleen, lung, and liver (panel I). Two-way ANOVA was performed in panels B and E. Abbreviations: n.s.: not significant; ROI: Region of Interest. Values represent means±SEM. *P< 0.05, **P< 0.01, ***P< 0.001.

