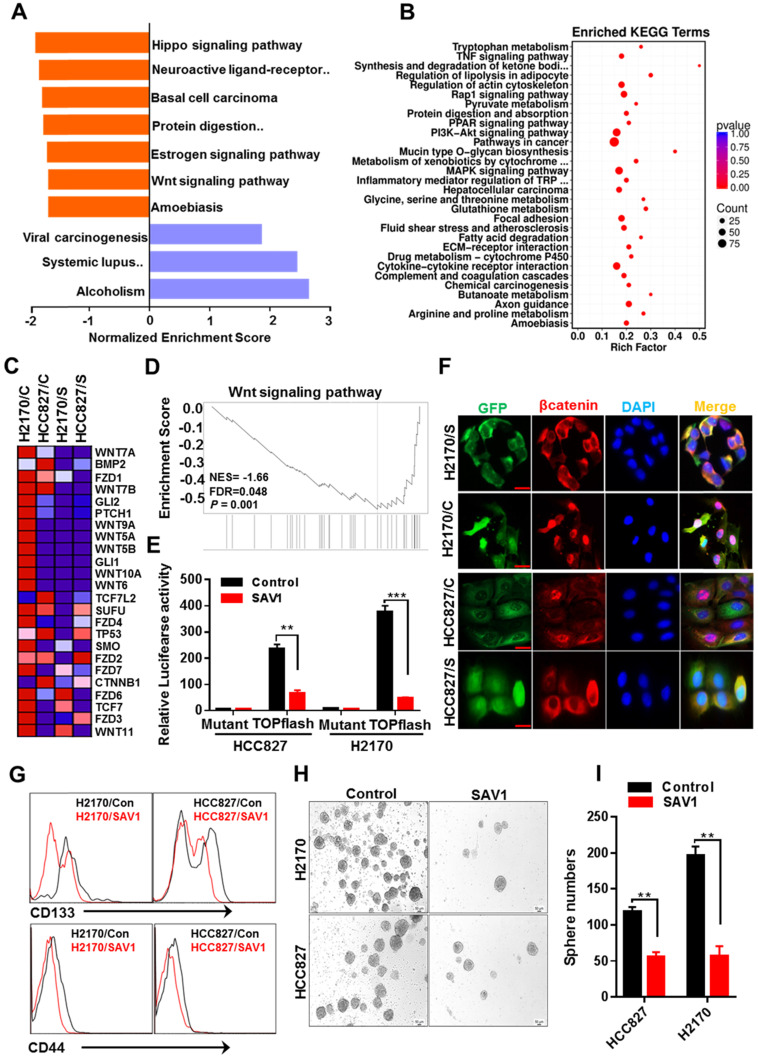
Figure 6.
Exogenous expression of SAV1 attenuates lung cancer stem cell traits by inhibiting WNT signaling. (A) Gene set enrichment analysis (GSEA) was performed on the expressed genes found in NSCLC cell lines with and without forced SAV1 expression, and the top 10 GSEA gene clusters were displayed. (B) KEGG pathway enrichment analysis of differentially expressed transcripts. (C, D) Heatmap (C) shows the differentially expressed genes related to the WNT signaling pathway in NSCLC cell lines, and the enrichment score (D) was shown. C represents control; S represents transduced SAV1. (E) Luciferase reporter assay (TOPflash) in NSCLC cell lines transfected with SAV1 and without. (F) The effect of SAV1 on the subcellular localization of β-catenin was determined by immunofluorescence (IF) staining for endogenous β-catenin (red) along with DAPI for DNA (blue). Scale bar: 50 µm. (G) Flow cytometry analysis of the indicated surface markers on NSCLC cell lines with and without forced SAV1 expression. (H, I) Sphere formation assay was performed and the sphere number was measured. Results represent means ± SD of at least two independent experiments. Statistical significance: p< 0.05 (Student's t-test). Scale bar: 50 µm.

