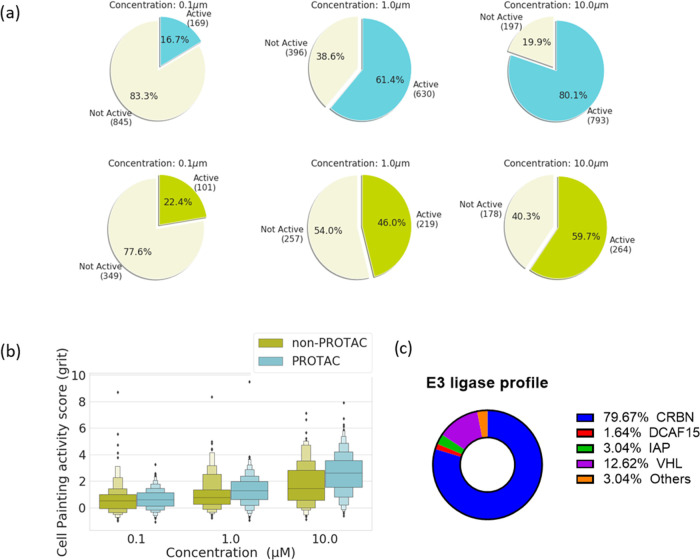
Figure 1.
Cell Painting activity score for PROTAC and non-PROTAC compounds. (a) Percentage of PROTAC and non-PROTAC compounds identified as active on the Cell Painting assay with the Euclidean-based method (i.e., compounds that are able to change the cellular morphology) at concentrations of 0.1, 1, and 10 μM. The Euclidean distance-based method showed that the number of active compounds increases as the concentration increases. (b) Cell Painting activity score in the form of the grit score across all concentrations (0.1, 1, and 10 μM). Both PROTAC and non-PROTAC compounds’ activity on the Cell Painting assay (in the form of the grit score) increased as the concentration increased. (c) Classification of the PROTAC molecules based on the E3 ligase used.

