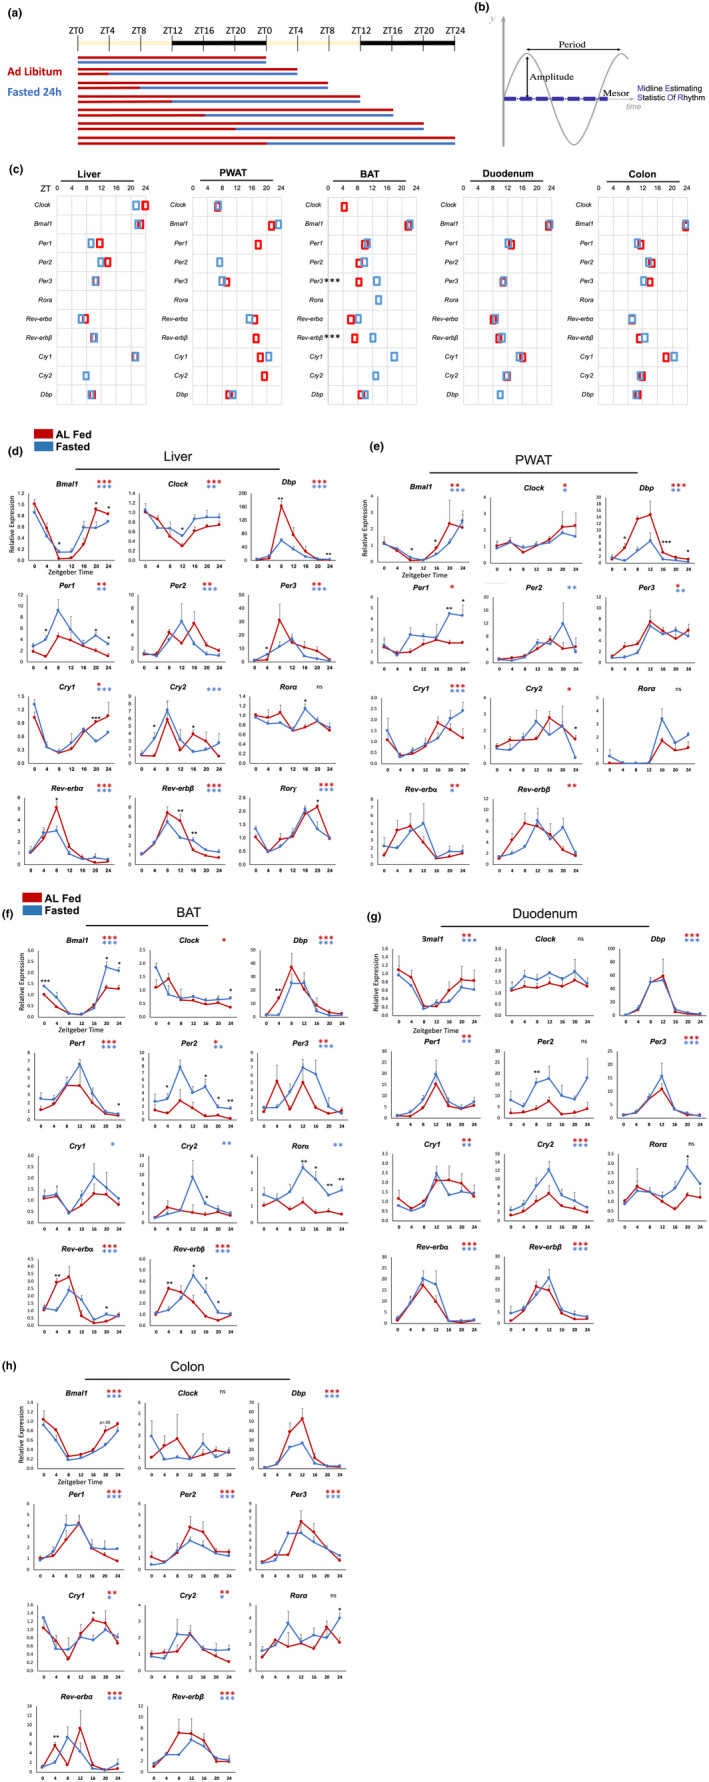
FIGURE 1.

Core clock rhythms in key metabolic organs of 24 h fasted mice. (a) Fasting schedule. (b) the three primary characteristics of rhythms: Period, amplitude, and Mesor—A rhythm‐adjusted mean expression level (MESOR, midline estimating statistic of rhythm). (c) Acrophase (time of peak expression) of significantly rhythmic core clock genes in AL fed (red) and 24 h fasted (blue) mice. (d–f) expression of core clock genes in liver, PWAT, BAT, duodenum, and colon. Data plotted relative to ZT0 fed as mean + SEM (n = 3 replicates per time point per group). Black asterisks indicate significant differences between fed and fasted groups at a particular timepoint (TTEST), n = 3 mice/timepoint/group. Colored asterisks indicate presence of 24 h rhythm. *p < 0.05, **p < 0.01, ***p < 0.001.
