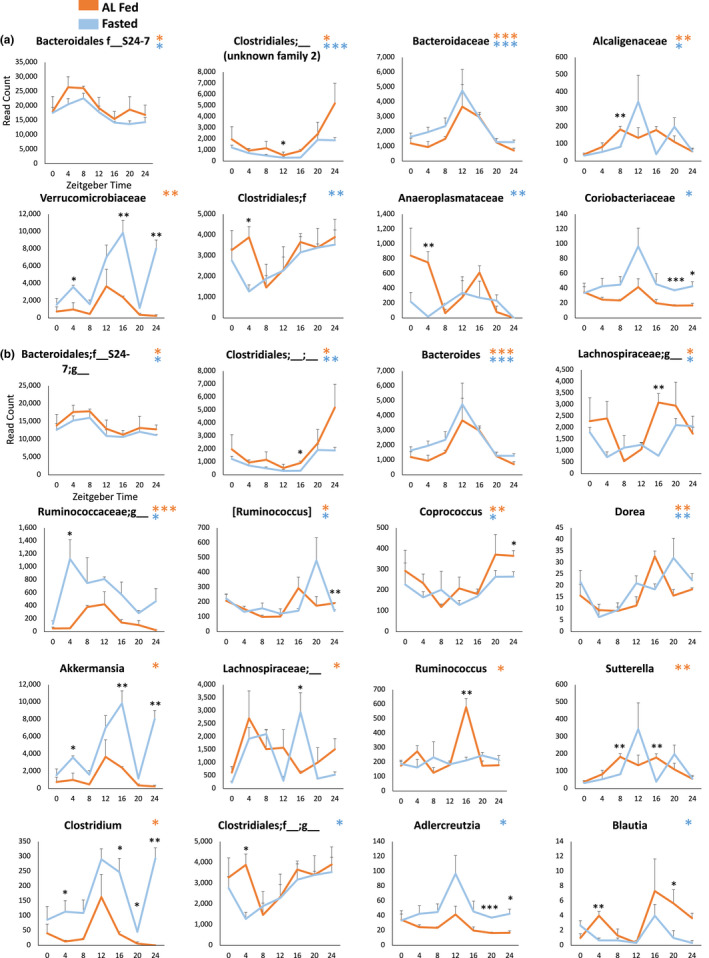
FIGURE 4.

Sub‐phylum microbiome rhythm analysis. Circadian rhythms in rarefied absolute abundances of bacterial families (a) and genera (b) in AL fed (orange) and 24 h fasted (blue) mice. Black asterisks indicate significant differences between fed and fasted groups at a particular timepoint (TTEST), n = 3 mice/timepoint/group. Colored asterisks indicate significant rhythmicity. *p < 0.05, **p < 0.01, ***p < 0.001.
