FIGURE 5.

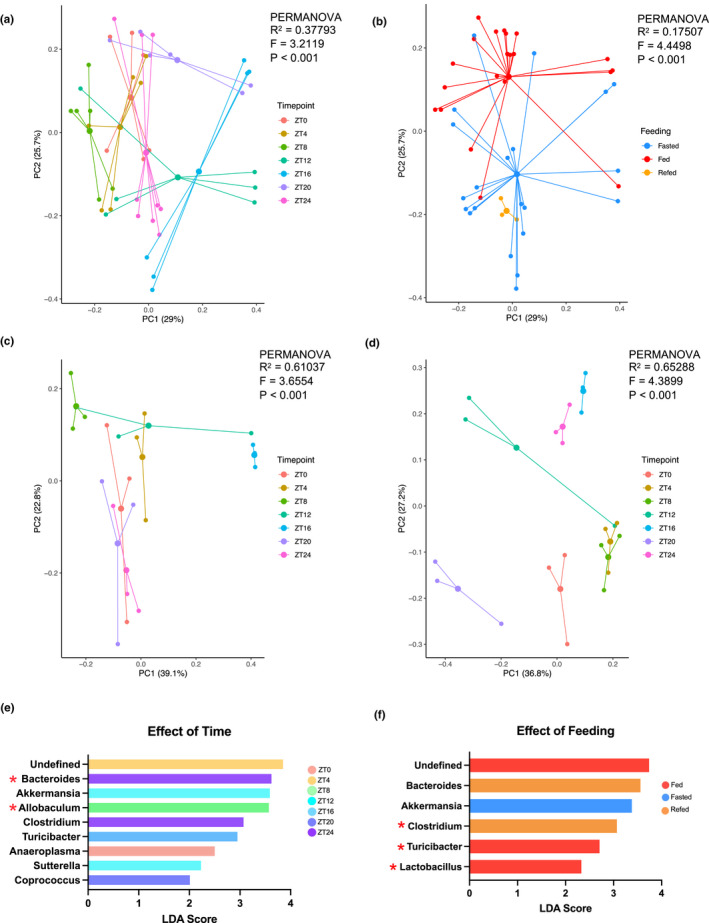
The effect of time of day and feeding versus fasting on microbiome composition. (a–d) PCoA plots of Bray‐Curtis dissimilarities. PERMANOVA was used to determine whether timepoint and feeding had a significant effect on microbiome composition. (a) the effect of time on microbiome composition. Data points are colored by timepoint (see legend). Color clustering by timepoint illustrates the 38% of variation explained by time. (b) the effect of feeding condition on microbiome composition. Data points are colored according to feeding group (see legend). 18% of variation was explained by feeding condition. (c) the effect of time in AL‐fed animals. (d) the effect of time in 24 h‐fasted animals. (E) Genera whose abundances significantly differed at particular timepoints (p < 0.05) with LDA scores >2 are shown. (f) Genera whose abundances significantly differed between feeding groups (p < 0.05) with LDA scored >2 are shown. Red stars indicate significant differences corroborated with ANCOM analysis.
